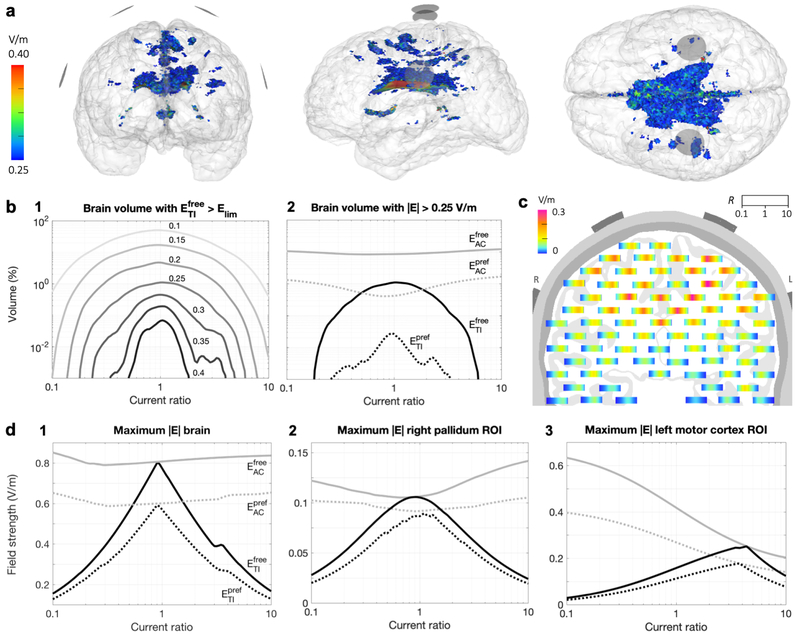
Figure 6: Study 1 – Stimulated brain volumes and maximal field strengths for tTIS and tACS.
a) Brain volume for which > 0.25 V/m for a simulation with IL = IR = 1 mA, visualized from the front, left and top, respectively; images are all on the same scale. Electrode surfaces are visualized as gray disks. See Fig. S4 for corresponding animations for other current ratios and other Elim values for tTIS and tACS. b-d) Results for simulations with current ratios R = IR/IL varied from 0.1 to 10 with IL + IR = 2 mA. b) Percentage of brain volume for which 1) surpasses various limits (values indicated in the plot in V/m), or 2) field strengths surpass 0.25 V/m, for tTIS (black) and tACS (gray) in either a free (continuous lines) or preferred direction (dotted lines). c) On a plane through the electrodes, viewing towards the posterior direction (L and R indicate left and right side of the head), each bar displays the local for all current ratios, where horizontal position within each individual bar corresponds to R ranging from 0.1 on the left to 10 on the right. d) Maximum field strength in the entire brain (1), and in small regions of interest (ROIs) in the right pallidum (2) and left motor cortex (3).

