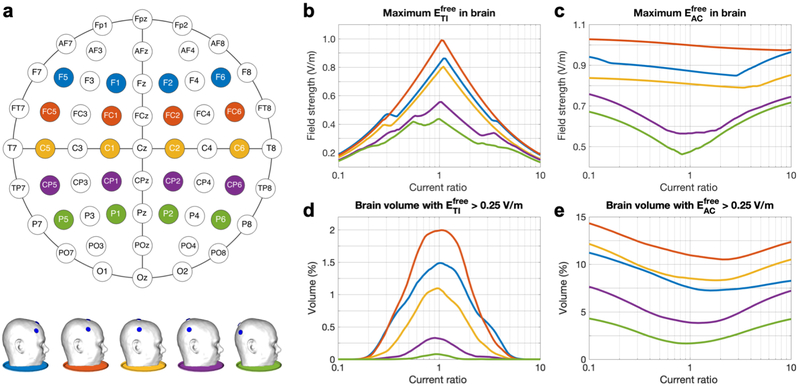
Figure 7: Study 2a – Simulations of tTIS and tACS with five standardized electrode configurations and various current ratios.
a) Schematic of the 10-10 system with the five configurations marked in different colors (top) and side view of the five head models (bottom). b,c) Maximum field strength in the brain, and d,e) percentage of brain volume stimulated at > 0.25 V/m for (b,d) and (c,e). Line colors match the schematic and models shown in panel a. See Fig. S5 for animations of stimulated brain volumes (similar to Fig. 6a) for tTIS and tACS for all configurations and current ratios.

