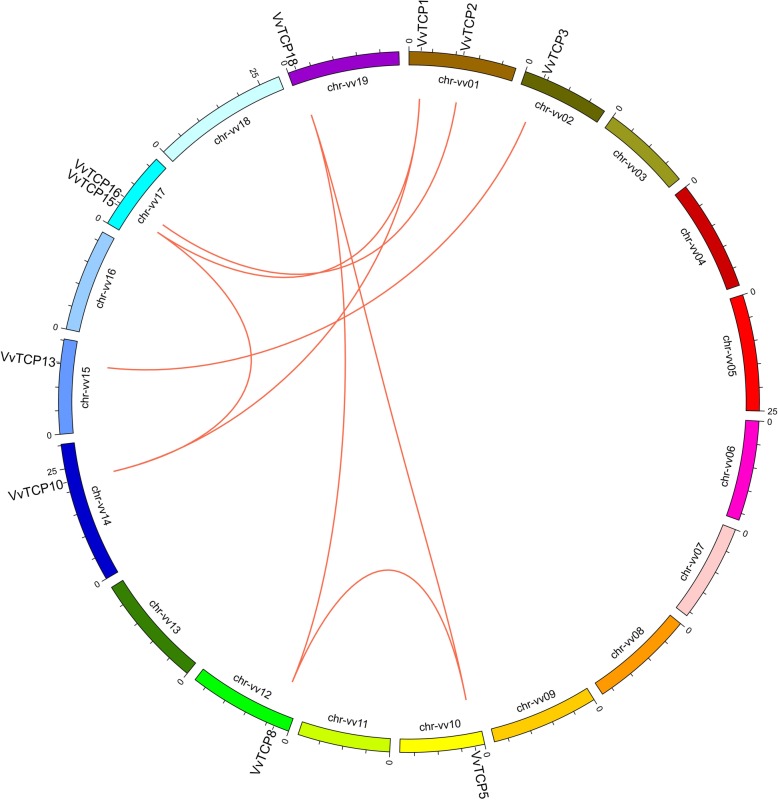
Fig. 4.
Chromosome distribution and synteny analysis of grape TCP genes. Chromosomes 1–19 are shown with different colours and in a circular form. The approximate distribution of each VvTCP gene is marked with a short line on the circle. Red curves denote the details of syntenic regions between grape TCP genes

