Figure 1.
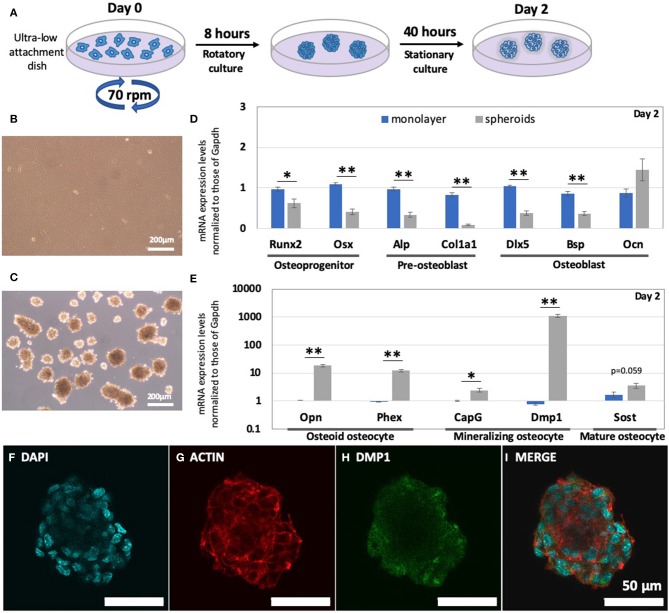
Enhanced levels of osteocyte markers of pre-osteoblast cells, in the form of spheroids. (A) Schematic of the method for fabricating bone spheroids using osteoblast precursor cells. Cells were subjected to a rotatory culture process in an ultra-low attachment dish for 8 h, followed by 40 h of the stationary culture process. Morphology of (B) monolayer and (C) bone spheroids after a 2-days incubation period. (D) mRNA expression levels of osteoprogenitor, pre-osteoblast, and osteoblast markers (Runx2, Osx, Alp, Col1a1, Dlx5, Bsp, and Ocn) in the monolayer and spheroids were measured by RT-PCR. (E) Osteocyte mRNA expression levels (Opn, Phex, CapG, Dmp1, and Sost) in the monolayer and spheroids were measured by RT-PCR. Graphs show that the mRNA expression levels were normalized to the Gapdh mRNA expression level. The bars represent the mean ± standard error (n = 7; p-value was obtained from student's t-test; *p < 0.05, **p < 0.005). Images after the staining of bone spheroids, 2 days after cultivation; (F) DAPI; (G) ACTIN; (H) DMP1; (I) MERGE.

