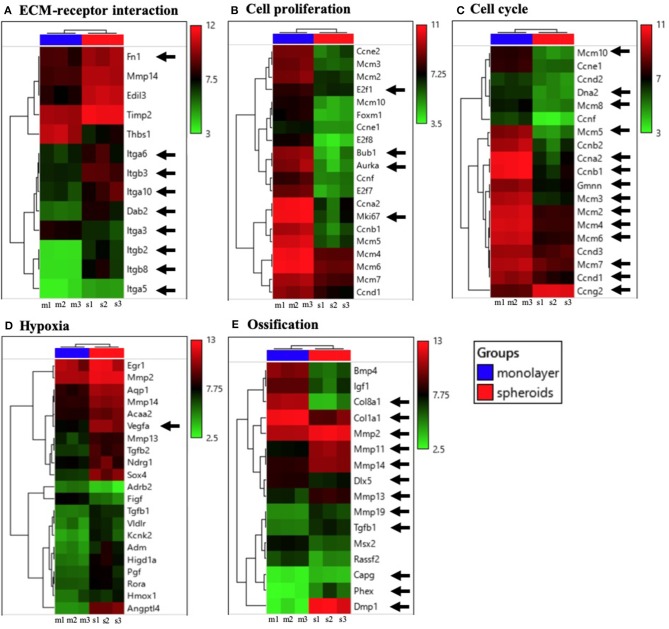
Figure 4.
Heatmaps of significantly modulated genes enriched in (A) ECM-receptor interaction, (B) cell proliferation, (C) cell cycle, (D) hypoxia, and (E) ossification. The relative gene expression levels, for which the fold-changes were above 2.0 or below 0.5, and whose p-value was lower than 0.05, were selected (n = 3).

