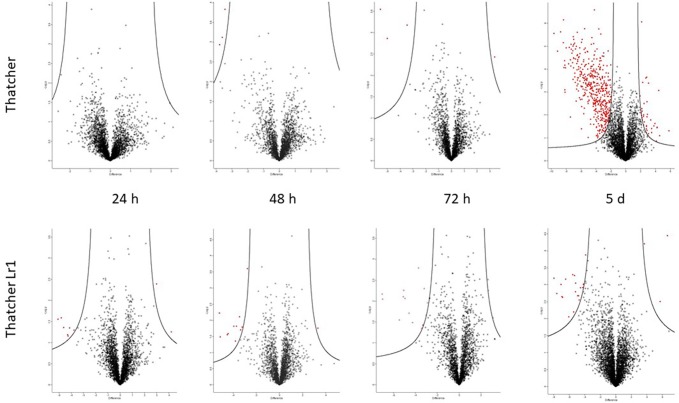
Figure 4.
Volcano plots generated by Perseus highlighting proteins whose abundance has changed significantly compared to the uninfected control. Proteins on the left of the volcano decreased in abundance, proteins to the right increased in abundance relative to the control (S0 = 1.5 and FDR = 0.05). The putative identities of these proteins are in Tables 2 and S3 . It is evident that most of the changes occurred in the susceptible interaction on day 5, at which point haustoria have formed.

