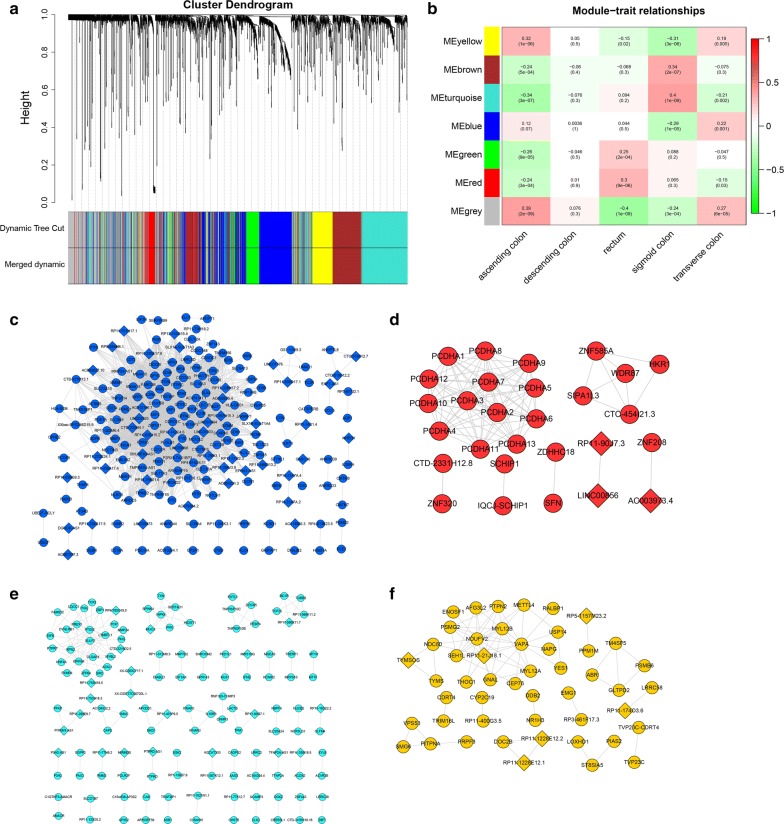
Fig. 2.
The co-expression network of different RNAs in different sites of CRC. A total of 217 clinical samples with RNA-seq data from Broad Institute’s GDAC Firehose were analysed. a The different modules in the gene co-expression network based on WGCNA. Each colour represents a module. b The correlation analysis between the modules and the sites of CRC. c–f The co-expression network with regard to transverse colon cancer, rectum cancer, sigmoid cancer and ascending colon cancer, respectively. The circle and the diamond represent mRNA and lncRNA, respectively

