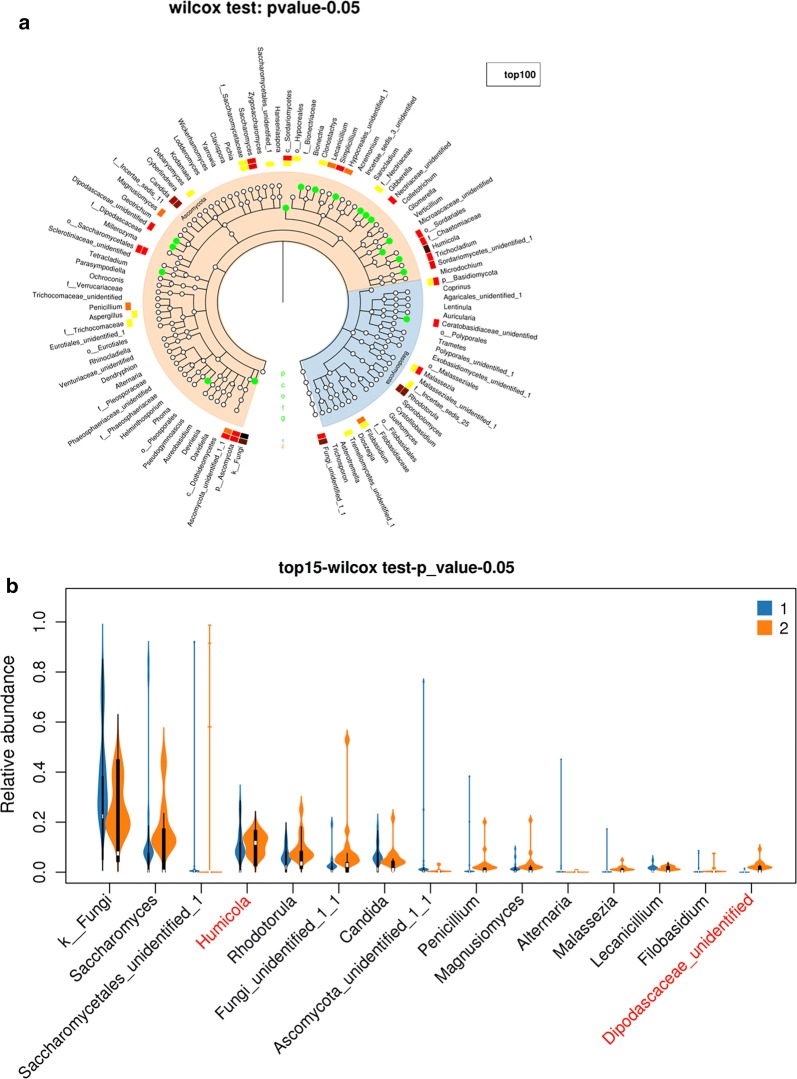
Fig. 8.
Different fungal community structure between rectal cancer and sigmoid cancer. Rectal cancer and sigmoid cancer was marked “1” group and “2” group, respectively. a The taxonomic tree heatmap, which displayed the relative abundance ratio of gut fungus in the top 100 at different taxonomic levels. The innermost layer shows the taxonomic tree. The circle from the inside to the outside represents different taxon levels from the phylum to the genus. The white circles represent no statistical difference, and the cyan circles represent the higher abundance of species in the sigmoid cancer group (Kruskal test, p-value < 0.05). The outermost layer is fungal annotation at the genus level. b The violin plot, which displayed the relative abundance of gut fungus in rectal cancer and sigmoid cancer in the top 15 at the genus levels. The red letters represent statistically different in the abundance of fungus

