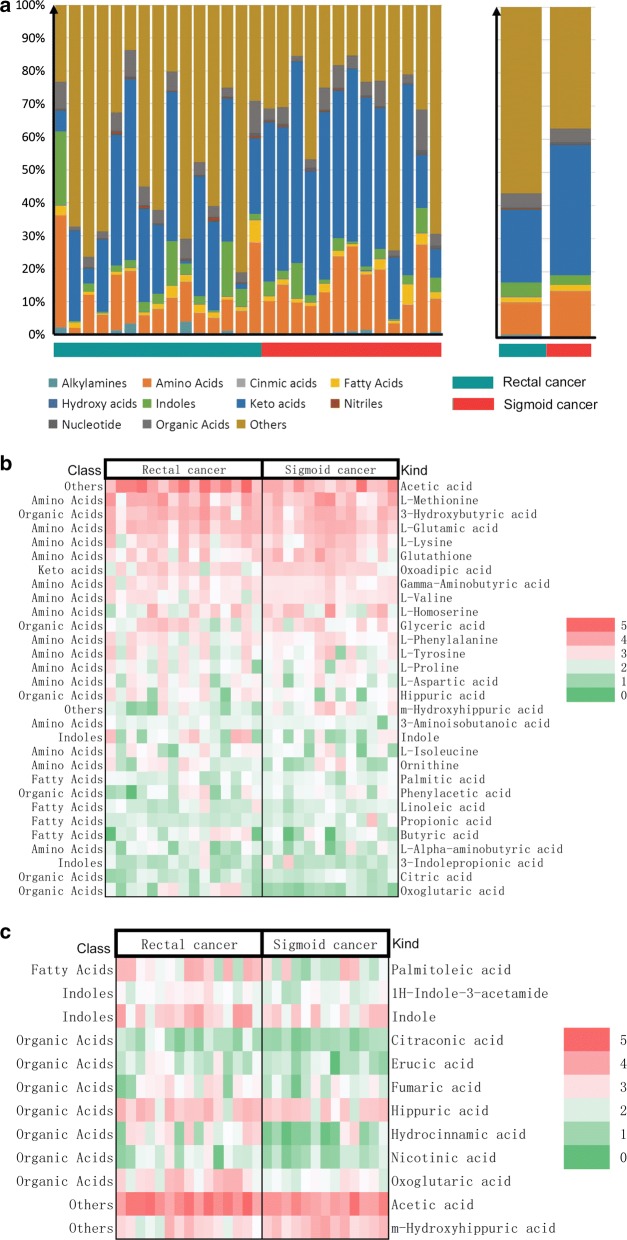
Fig. 9.
Different microbial metabolites between rectal cancer and sigmoid cancer. a The left shows the composition and proportion of microbial metabolites in rectal and sigmoid cancers at the class level. The a on the right shows the concentration of microbial metabolites in the same site combined into a group. The number of nanogram metabolites per milligram of faeces was analysed. The logarithm of metabolite content (ng/mg) was taken to build the heatmap for better display. b The content of the top 30 microbial metabolites in rectal and sigmoid cancers. c The content of microbial metabolites with statistical differences between the two groups (Kruskal test, p-value < 0.05)

