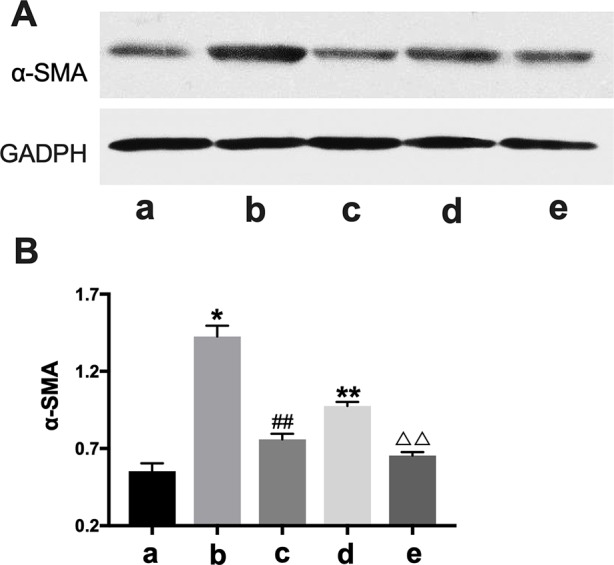
Figure 7.

Western blot analysis of α-SMA expression. CTGF, connective tissue growth factor. BXYS, Buxin Yishen decoction. CHF, chronic heart failure. α-SMA: alpha smooth muscle actin. a: BLANK group. b: BLANK+CTGF group. c: CTGF+BXYS group. d: CHF group. e: CHF+BXYS group. *P < 0.05, **P < 0.01 vs. BLANK group. ##P < 0.01 vs. BLANK+CTGF group. ΔΔP < 0.01 vs. CHF group. (A) α-SMA expression in cells. (B) Quantitative analysis of western blot.
