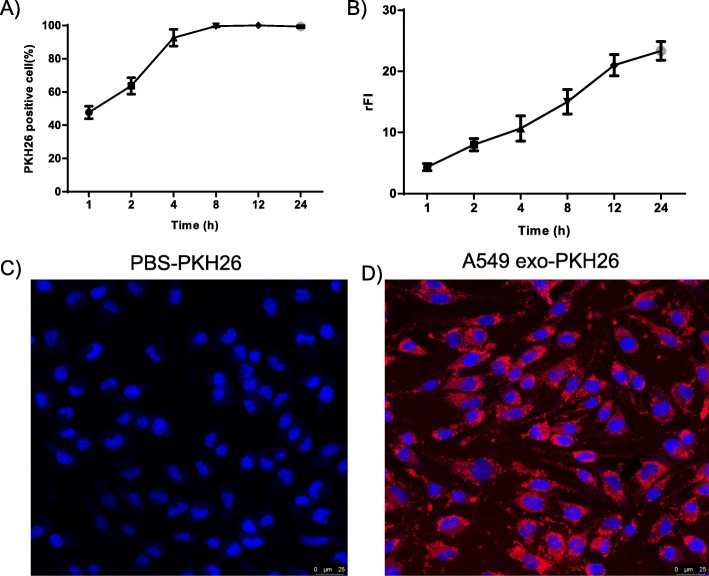
Fig. 3.
Uptake of A549 cell-derived exosomes by mast cells. a and b The percent positive cells and relative fluorescence intensity (rFI) data for different time points were determined with flow cytometry for 1–24 h and are shown as the means ± SEM (n = 3). c and d) Uptake of PKH26-PBS control and PKH26-labeled exosomes by fluorescence microscopy imaging. Nuclei were stained with DAPI (blue)

