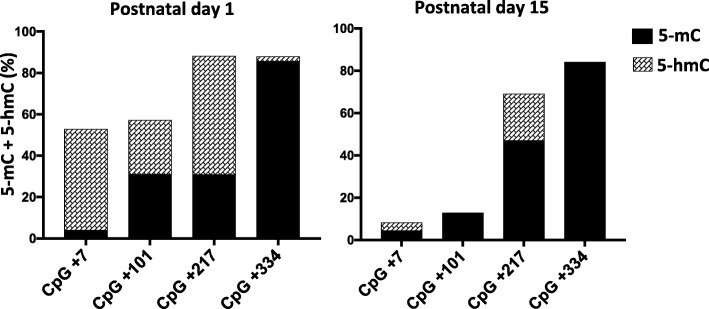
Fig. 3.
Analysis of 5-mCpG and 5-hmCpG content at single-CpG resolution of the Dao regulatory region in the cerebellum. Bar plots represent methylation (black) and hydroxymethylation (line pattern) levels at individual CpG site in Dao regulatory region at the P1 to P15 stages. Average 5-hmC levels was calculated by subtracting values obtained from sequence analysis of DNAs treated with an oxidant reagent plus sodium bisulfite to the average methylation values obtained from DNA treated with bisulfite only. For each time point, results are indicated as the mean of n = 3 mice

