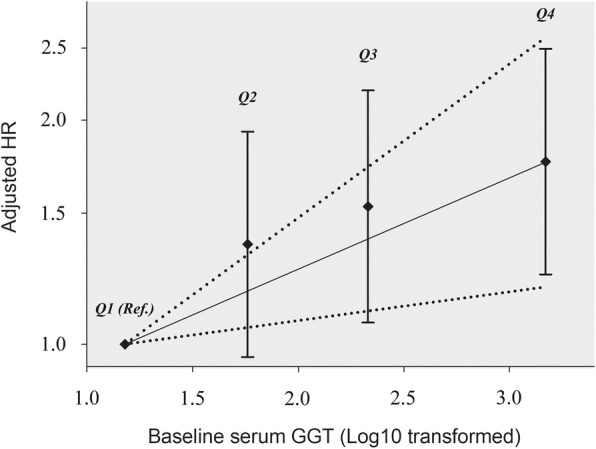
Fig. 2.

Dose-response association between baseline serum GGT and the OS in metastatic PDAC patients. Adjusted for age at diagnosis, palliative chemotherapy, baseline ALB, and baseline FPG. The estimated dose-response trend and its 95% confidence band are given in solid and dotted lines, respectively. The Y-axis represents 1og10(HR), thus intervals are not equally spaced. GGT, Gamma-glutamyltransferase; ALB, albumin; FPG, fasting plasma glucose
