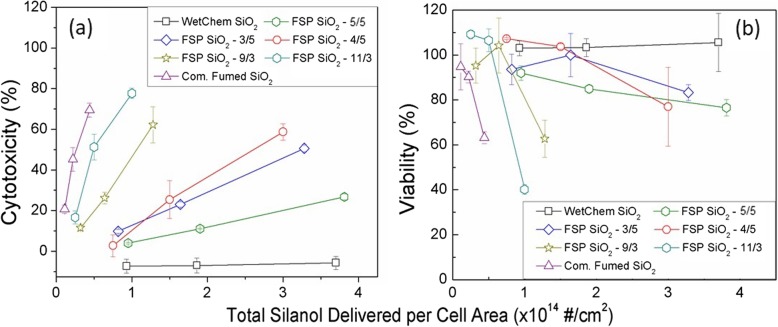
Fig. 3.
a Cytotoxicity, compared to the negative control (untreated cells), as measured by the LDH Cytotoxicity Assay Kit; and (b) Viability, compared to the negative control, (PrestoBlue assay) measured in the RAW264.7 macrophages. The x-axis represents the total delivered-to-cells silanol group, per cell area, adjusted for dosimetry, for the three administered doses. Data represent the average and the standard error of three independent experiments performed in triplicate

