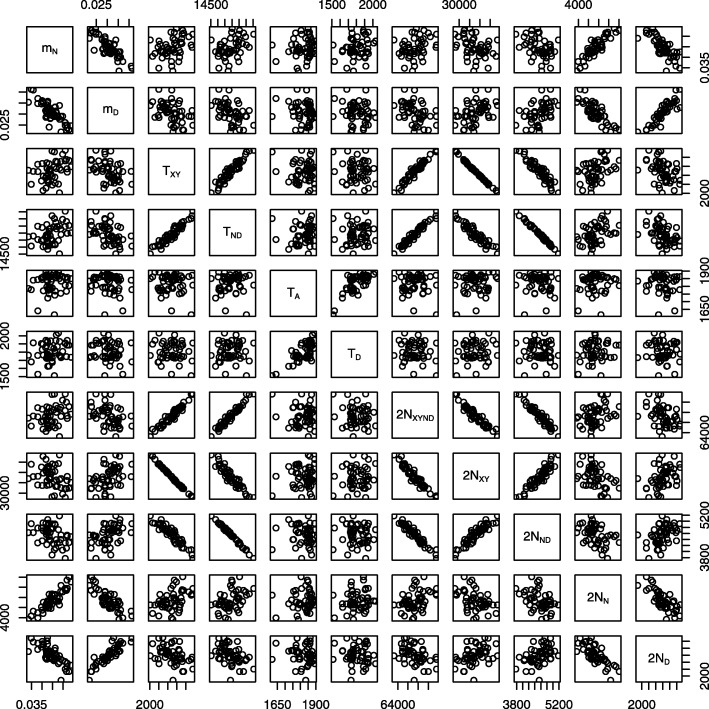
Fig. 3.
Associations between pairs of parameter estimates in 50 data sets simulated with msprime [21] under the model in Fig. 1. Key: mN, fraction of admixture from N into Y; mD, fraction of admixture from D into Y; TXY, separation time of X and Y; TND separation time of N and D, TA, age of fossil genome from population N; TD, age of fossil from D; NXYND, size of ancestral population; NXY, size of population ancestral to X and Y; NND, size of population ancestral to N and D; NN, size of population N; ND, size of population N. The separation time, TXYND, of XY and ND was fixed exogeneously to calibrate the molecular clock

