Fig. 4.

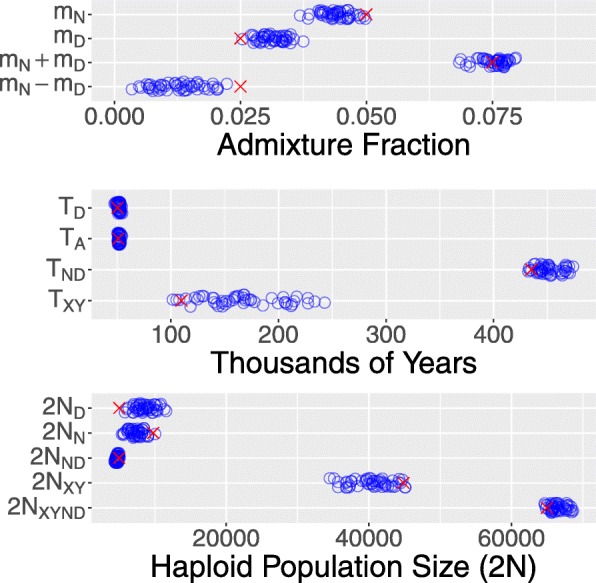
Sampling distributions of legofit estimates based on the 50 simulated data sets shown in Fig. 3. Red crosses represent true parameter values. Points have been vertically jittered to reduce overplotting in this figure and in those that follow

Sampling distributions of legofit estimates based on the 50 simulated data sets shown in Fig. 3. Red crosses represent true parameter values. Points have been vertically jittered to reduce overplotting in this figure and in those that follow