Figure 1.
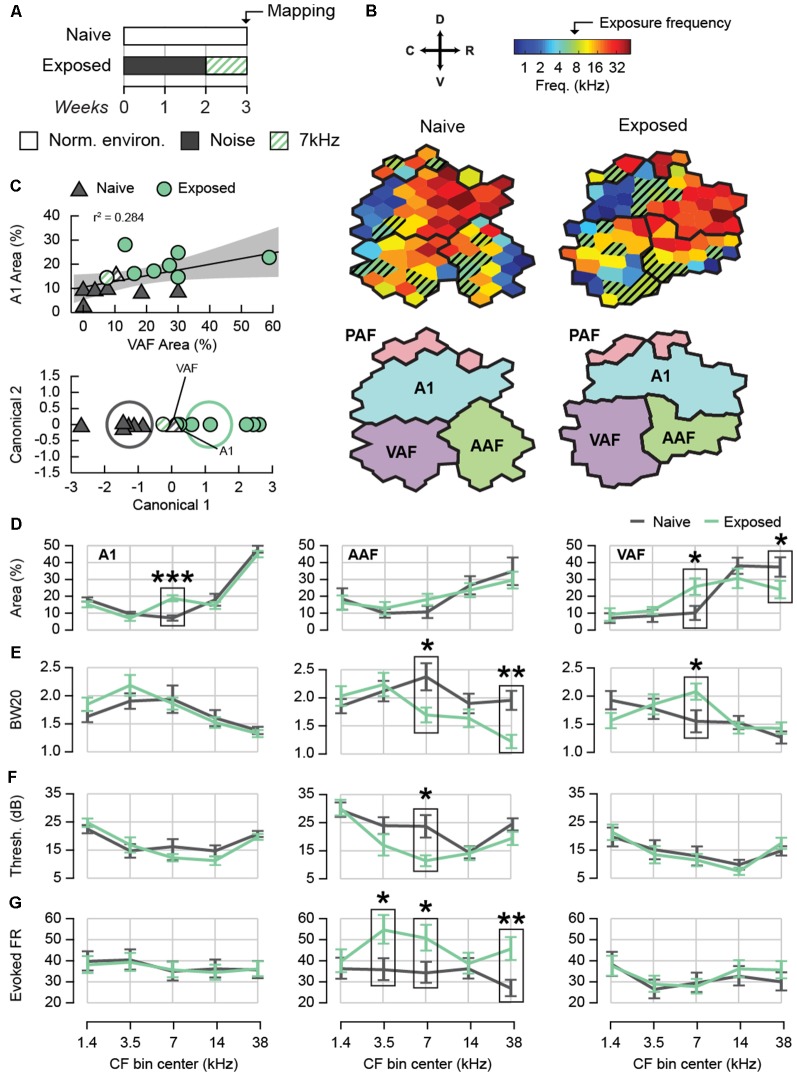
Effect of sound exposure on cortical tuning and tone-evoked activity. (A) Sound exposure protocol. Naïve rats were housed in a normal acoustic environment while exposed rats were passively exposed to 2 weeks of moderate-intensity broadband white noise followed by 1 week of 7 kHz tone pips. (B) An example characteristic frequency (CF) map from each experimental group containing all auditory fields. Hatched sites represent those with a CF of 7 kHz ± octave. (C) Top: correlation between the percent A1 area and percent VAF area with a CF of 7 kHz ± octave. Shaded region represents 95% confidence of fit for the regression. Bottom: canonical plot of the linear discriminant analysis based on the percent of A1 and VAF area with a CF of 7 kHz ± octave. Rats were automatically classified as either naïve or exposed; hatched points identify rats that were misclassified. Ellipses represent the 95% confidence region for the true mean of each group. (D) Average map area with CF in five frequency bins. Only full auditory fields were used for map percentages. (E) Average BW20 for receptive fields with CF in five frequency bins. (F) Average cortical threshold for receptive fields with CF in five frequency bins. (G) Average tone-evoked firing rate for units with CF in five frequency bins. *p < 0.05, **p < 0.01, ***p < 0.001. Error bars represent standard error of the mean (SEM). A1, primary auditory field; AAF, anterior auditory field; VAF, ventral auditory field; PAF, posterior auditory field. See Table 1 for number of rats, recording positions, and cortical sites per auditory field and group.

