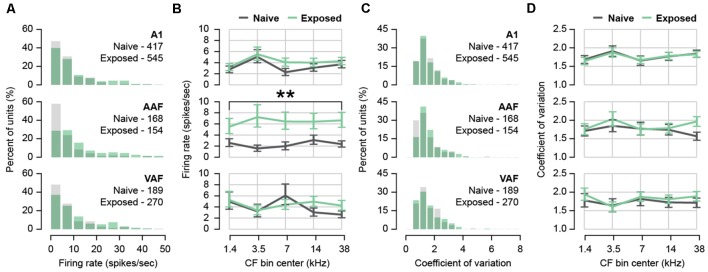
Figure 2.
Effect of sound exposure on spontaneous firing rate and burst firing. (A) Histogram of firing rates for each auditory field. N units per field and group in inset. (B) Back-transformed mean firing rate with CF in five frequency bins for each auditory field. (C) Histogram of coefficient of variation (CV) for each auditory field. N units per field and group in inset. (D) Back-transformed mean CV in five frequency bins for each auditory field. **p < 0.01. Error bars represent SEM. A1, primary auditory field; AAF, anterior auditory field; VAF, ventral auditory field. See Table 1 for number of rats, recording positions, and units per auditory field and group.

