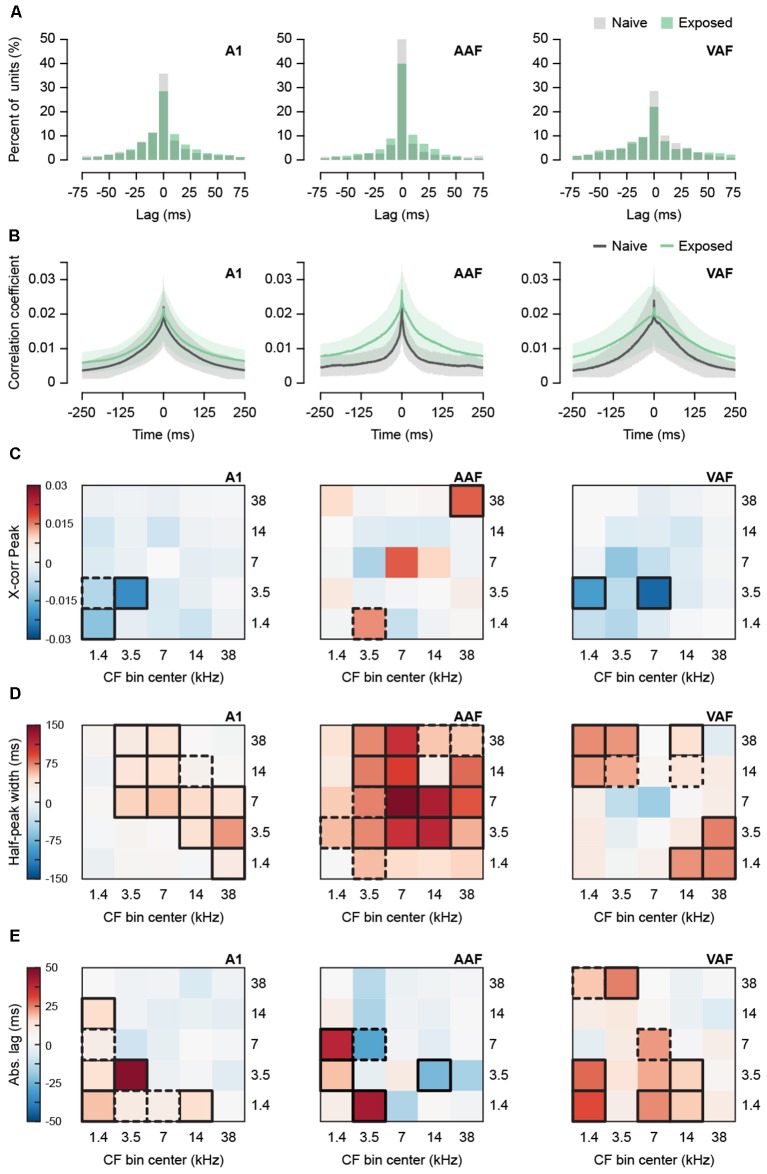
Figure 3.
Effect of sound exposure on spontaneous synchronization. (A) Histogram of lag times of the peak of the cross-correlogram for all recorded unit pairs in A1, AAF, and VAF. Data for lag times outside −75 and 75 are not shown. (B) Average cross-correlogram for all unit pairs detected in separate channels in A1, AAF, and VAF. Shaded region represents SEM. (C) Subtracted (Exposed—Naïve) difference between average peak correlation coefficient for unit pairs with CF in five frequency bins. (D) Subtracted (Exposed—Naïve) difference between average half-peak width for unit pairs with CF in five frequency bins. (E) Subtracted (Exposed—Naïve) difference between average time lag in absolute values of the peak of the cross-correlogram. Bolded boxes are significant with p < 0.05. Dashed boxes represent p-values < 0.10. A1, primary auditory field; AAF, anterior auditory field; VAF, ventral auditory field; CF, characteristic frequency. N unit pairs per auditory field and group: Naïve A1 3,614; AAF 746; VAF 1,092. Exposed A1 6,116; AAF 733; VAF 1,707. See Table 1 for number of rats, recording positions, and units per auditory field and group.

