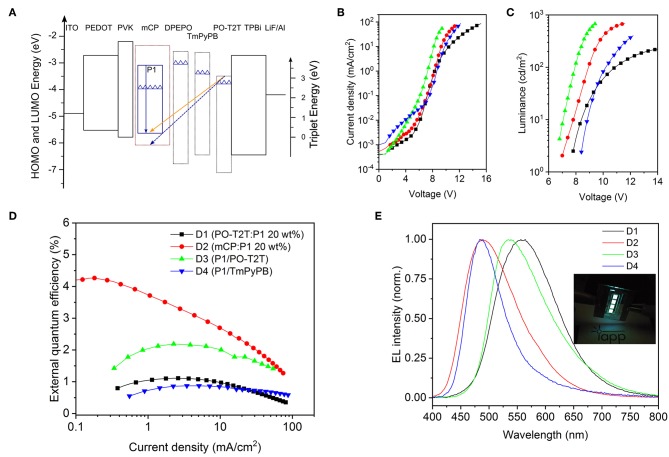
Figure 3.
Monochrome OLEDs based on P1. (A) Schematic diagram of energy levels of representative devices (Su et al., 2008; Wu et al., 2017). The top line of each box indicates the LUMO, and the bottom line refers to the HOMO level. The solid blue arrow represents the intrinsic emission from the TADF polymer P1, while the orange arrow represents the CT-emission between PO-T2T and P1, and the dashed blue line represents the possible CT-emission between host mCP and PO-T2T (Liu et al., 2015; Wu et al., 2017). The triangles refer to the triplet energy levels (Su et al., 2008; Wu et al., 2017). (B) Voltage-current density characteristics, (C) voltage-luminance characteristics, and (D) current density-external quantum efficiency dependencies of monochrome devices. Panels B–D share the same legend. (E) Respective normalized EL spectra at 100 cd/m2. The inset picture is a photo of the OLEDs with mCP as host material.

