Figure 5.
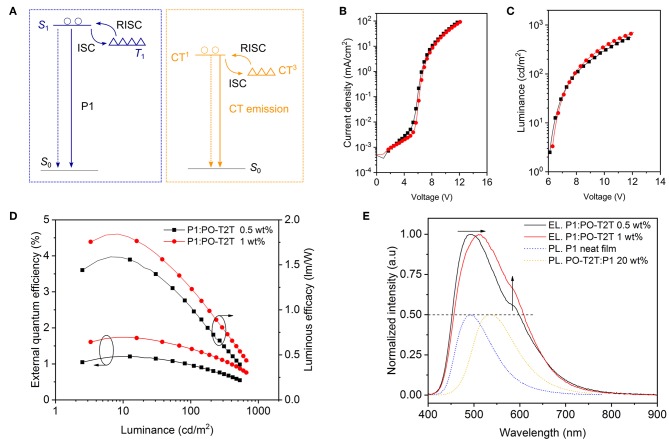
Single layer OLEDs with dual emission from the intramolecular CT of P1 and the intermolecular CT-state between P1 and PO-T2T (D5 and D6 of Table 2). (A) Simplified energy level diagram for the mixed film comprising P1 and PO-T2T. The solid lines represent the radiative relaxation, while dashed lines represent the non-radiative loss. (B) The voltage-current density, (C) the voltage-luminance, and EQE-luminance-luminous efficacy characteristics of D5 and D6. (B–D) share the same legend. (E) Normalized EL spectra for D5 and D6 in the forward direction obtained at 100 cd/m2. The dotted PL spectra of P1 and the P1:PO-T2T CT state are shown for comparison and normalized to 0.5. The dashed line represents the FWHM of the EL spectrum. The arrows indicate that the fraction of yellow part from the intermolecular CT-emission is increasing for higher concentration of PO-T2T in the emission layer.

