Figure 4.

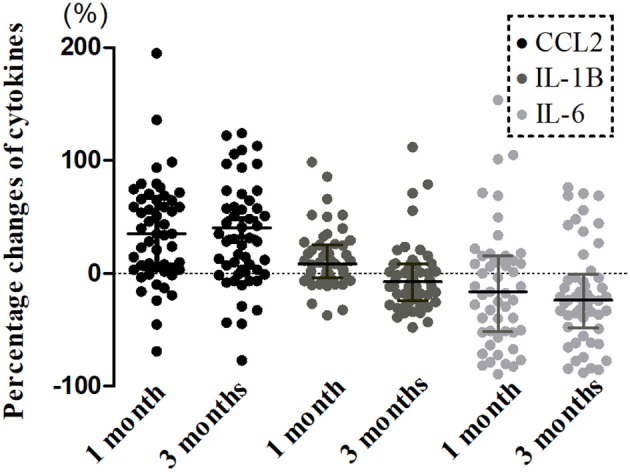
Percentage changes from acute phase to follow-ups in levels of serum cytokines in mTBI patients. Boxplots represent medians and interquartile (n = 52 for both time points).

Percentage changes from acute phase to follow-ups in levels of serum cytokines in mTBI patients. Boxplots represent medians and interquartile (n = 52 for both time points).