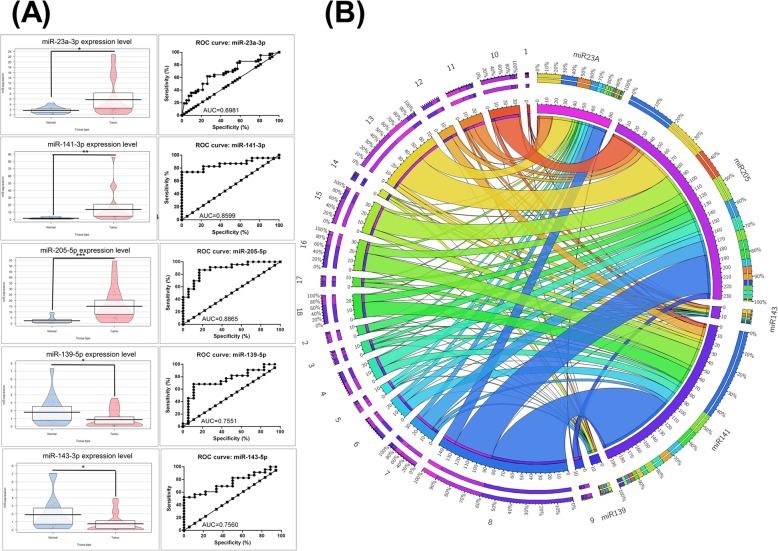
Fig. 4.
qRT-PCR data validation. a Left panel of Pirate Plots presents the expression level for miR-23a-3p, miR-139-5p, miR-141-3p, miR-143-5p and miR-205-5p in the new validation set comprised of healthy (n = 18) and tumor tissues (n = 18). The data was normalized using U6 based on ΔΔCt method (*p < 0.05, **p < 0.01, ***p < 0.001). Right panel of graphs presents ROC curves for each selected miRNA’s specificity and sensitivity (ROC: receiver-operating characteristic, AUC: area under ROC curve). b Circos diagram representing the expression level for the validated miRNA transcripts in tumoral tissues of the new patient cohort

