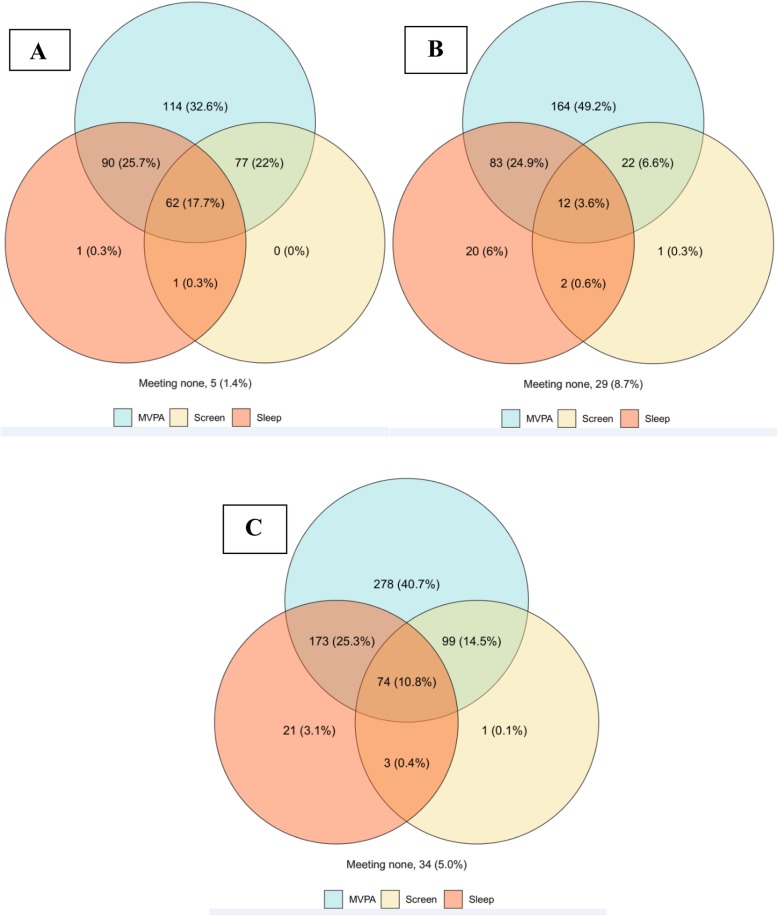
Fig. 1.
(n = 683): Venn diagrams showing the number and proportion of participants meeting no guidelines, the moderate-to-vigorous physical activity (MVPA), recreational screen time (screen), and sleep duration recommendations, and various combinations of the recommendations for the rural participants (panel 1a), urban participants (panel 1b), and the whole sample (panel 1c)

