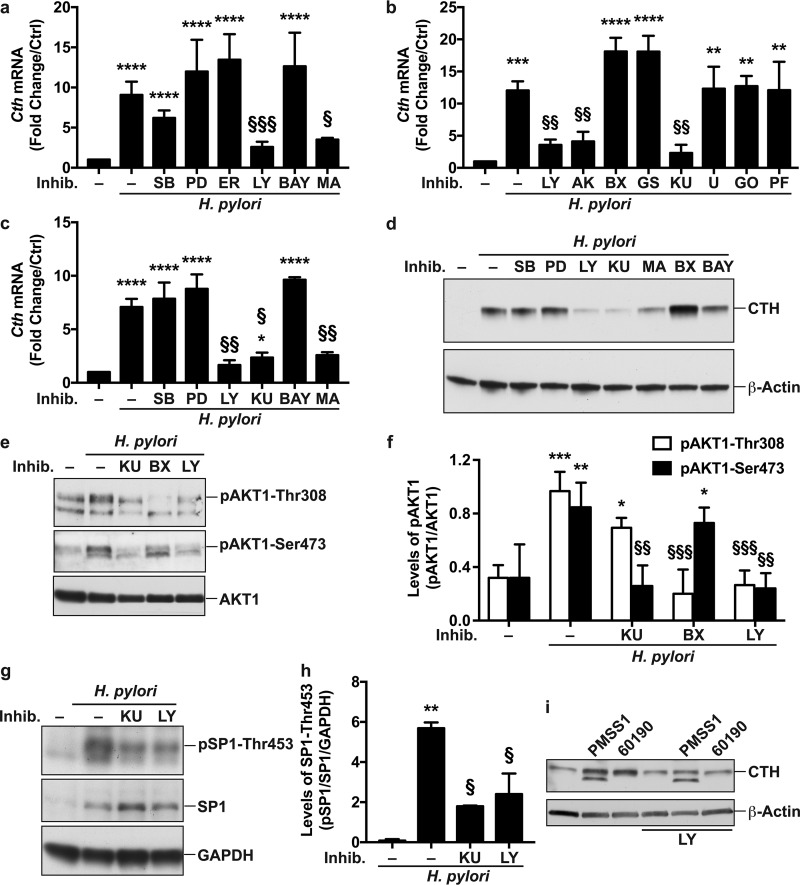
FIG 2.
Signal transduction involved in CTH induction. (a to c) RAW 264.7 cells (a and b) or BMmacs (c) were pretreated or not for 30 min with SB203580 (SB), PD98059 (PD), an ERK inhibitor (ER), LY294002 (LY), Bay 11-7082 (BAY), mithramycin A (MA), an AKT inhibitor (AK), BX795 (BX), GSK650394 (GS), KU0063794 (KU), U-73122 (U), GO6983 (GO), or PF-4708671 (PF) for 30 min prior to infection with H. pylori PMSS1. Cth mRNA expression was analyzed after 6 h. **, P < 0.01; ***, P < 0.001; ****, P < 0.0001 (versus uninfected cells); §, P < 0.05; §§, P < 0.01; §§§, P < 0.001 (versus H. pylori-infected cells) (n = 3 to 6 for panels a and b, and n = 4 mice for panel c). (d) CTH and β-actin levels were assessed by Western blotting from macrophages pretreated with the pharmacological inhibitors and infected with H. pylori for 24 h. Shown are representative data from 3 independent experiments. (e) Representative Western blot (n = 3) of pAKT1-Thr308, pAKT1-Ser473, and AKT1 in macrophages 1 h after infection with H. pylori PMSS1. (f) Densitometric analysis of pAKT1-Thr308, pAKT1-Ser473, and AKT1 levels. (g) Representative Western blot (n = 3) of pSP1-Thr453, SP1, and glyceraldehyde-3-phosphate dehydrogenase (GAPDH) in macrophages after 3 h of infection with H. pylori PMSS1. (h) Densitometric analysis of pSP1-Thr453. *, P < 0.05; **, P < 0.01; ***, P < 0.001 (versus uninfected cells); §, P < 0.05; §§, P < 0.01; §§§, P < 0.001 (versus H. pylori-infected cells) (for panels f [n = 3] and h [n = 3]). (i) CTH and β-actin levels in PMA-differentiated THP-1 cells, pretreated or not for 30 min with LY294002 and then infected with H. pylori PMSS1 or 60190 for 24 h. Shown is a representative blot from 2 independent experiments.

