FIG 3.
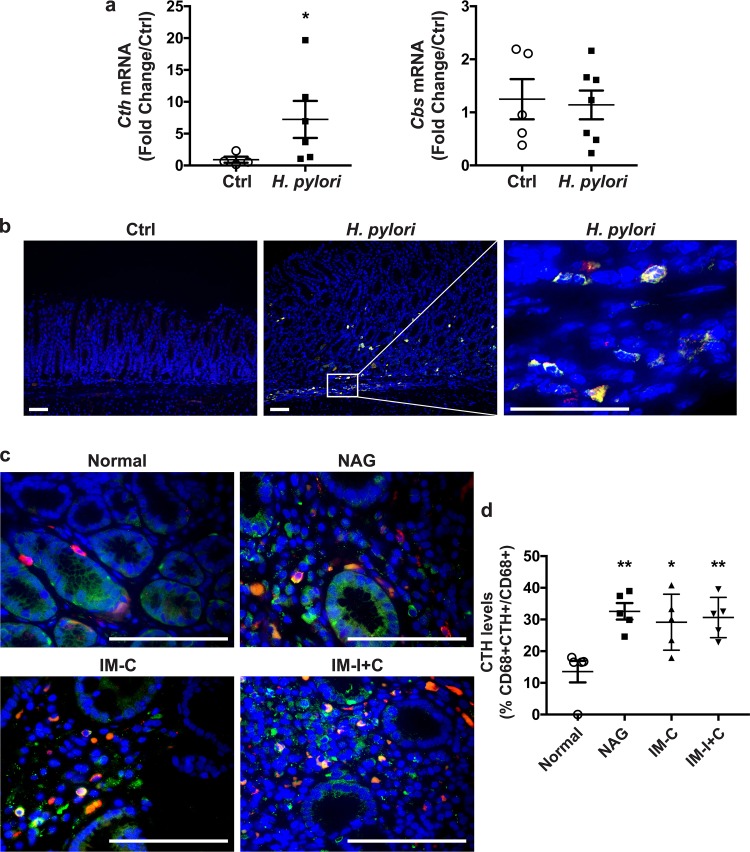
Expression of CTH in gastric tissue during H. pylori infection. (a) Cth and Cbs mRNA expression in the gastric tissue of C57BL/6 mice infected or not (control [Ctrl]) with H. pylori PMSS1 for 2 months. *, P < 0.05 (versus uninfected cells). (b) The macrophage marker CD68 (red), CTH (green), and nuclei (blue) were detected by immunofluorescence. Merged images are shown, with cells double positive for CD68 and CTH depicted in yellow. Representative images for 5 mice in each group are shown. (c) Expression of CTH and CD68 in patients infected or not (normal) with H. pylori, as described above for panel b. (d) Quantification of CTH staining in macrophages. NAG, nonatrophic gastritis; IM-C, complete intestinal metaplasia; IM-I+C, incomplete and complete intestinal metaplasia. *, P < 0.05; **, P < 0.01 (versus normal patients).

