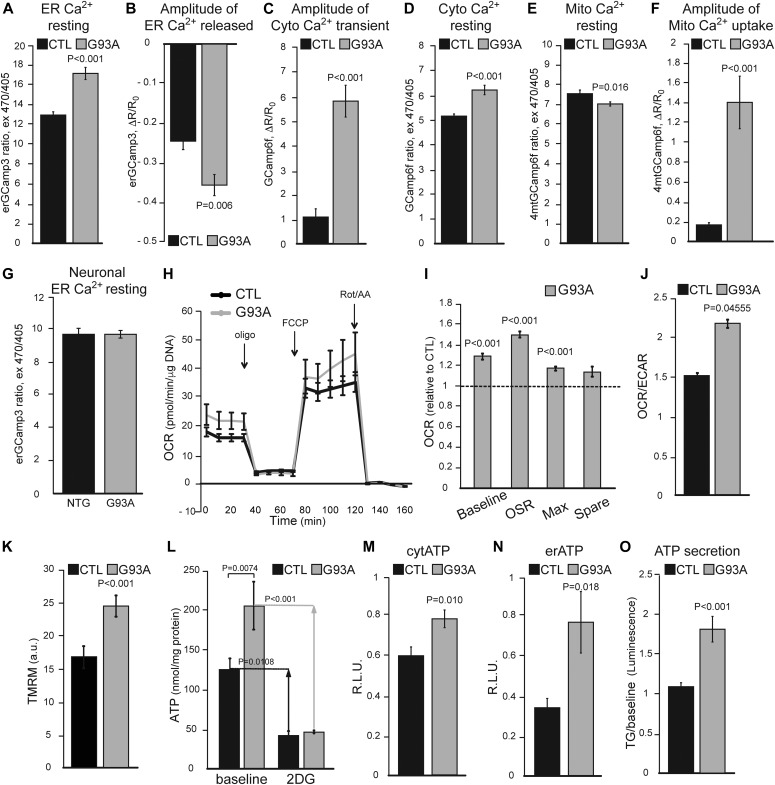
Figure 6. ER calcium dynamics and energy metabolism are increased in G93A iPSAs.
(A) Resting ER calcium levels in CTL and G93A iPSAs, measured with erGCaMP3. n = 207, 209 cells from two sets of experiments. (B) ER calcium released in CTL and G93A iPSAs upon ER calcium release stimulation with 100 μM ATP, measured as erGCaMP3 fluorescence drop. n = 24 cells for each genotype, from two sets of experiments. (C) Cytosolic calcium peak in CTL and G93A iPSAs upon 100 μM ATP stimulation, measured with GCaMP6f. n = 38, 37 cells from four sets of experiments. (D) Resting cytosolic calcium in CTL and G93A iPSAs measured with GCaMP6f. n = 220, 192 cells from two sets of experiments. (E) Resting mitochondrial calcium levels in CTL and G93A iPSAs, measured with GCamp6f targeted to mitochondria (4mtGCaMP6f). n = 195, 171 cells from three sets of experiments. (F) Mitochondrial calcium uptake in CTL and G93A iPSAs upon 100 μM ATP stimulation measured with 4mtGCaMP6f. n = 20, 20 cells in three sets of experiments. (G) Resting ER calcium levels in primary cortical neurons from non-transgenic (NTG) and G93A SOD1 (G93A) mice, measured with erGCaMP3. n = 76, 86 cells from two sets of experiments. In (A, B, C, D, E, F, G), P value determined by Mann–Whitney test is shown. (H) Representative curves of OCR in CTL and G93A iPSAs. Oligomycin (oligo), uncoupler FCCP (FCCP), rotenone and antimycin A (Rot/AA) were added at the indicated times. (I) Quantification of OCR metrics, normalized to CTL, including OCR baseline (Baseline), oligomycin sensitive rate (OSR), maximal respiration (Max), and spare respiratory capacity (Spare). (J) Average OCR/ECAR ratio determined from baseline OCR and ECAR values from each experiment. n = 15 wells from three individual experiments. P values by unpaired t test are indicated. (K) Mitochondrial membrane potential in CTL and G93A iPSAs assessed by the potentiometric dye TMRM. n = 60 cells from two individual experiments. P value by unpaired t test is indicated. (L) ATP content measured by a luciferase-based assay in CTL and G93A iPSAs, in glucose medium (baseline) or 2-deoxyglucose (2DG) containing medium. Arrows indicate the difference between baseline and upon 2DG treatment. n = 6 wells from two individual experiments. P values between indicated groups by paired one-way ANOVA test with Sidak’s correction are shown. (M, N) ATP content in the cytosol (M) and ER (N) in CTL and G93A iPSAs, measured with luciferase-based reporter plasmids. n = 8 wells from four sets of experiments. P value by unpaired t test is indicated. (O) Quantification of ATP secreted into the conditioned medium by CTL and G93A iPSAs, upon ER calcium release induction with 5 μM thapsigargin (TG). n = 17 lysates from three sets of experiments. P value by Mann–Whitney test is indicated.

