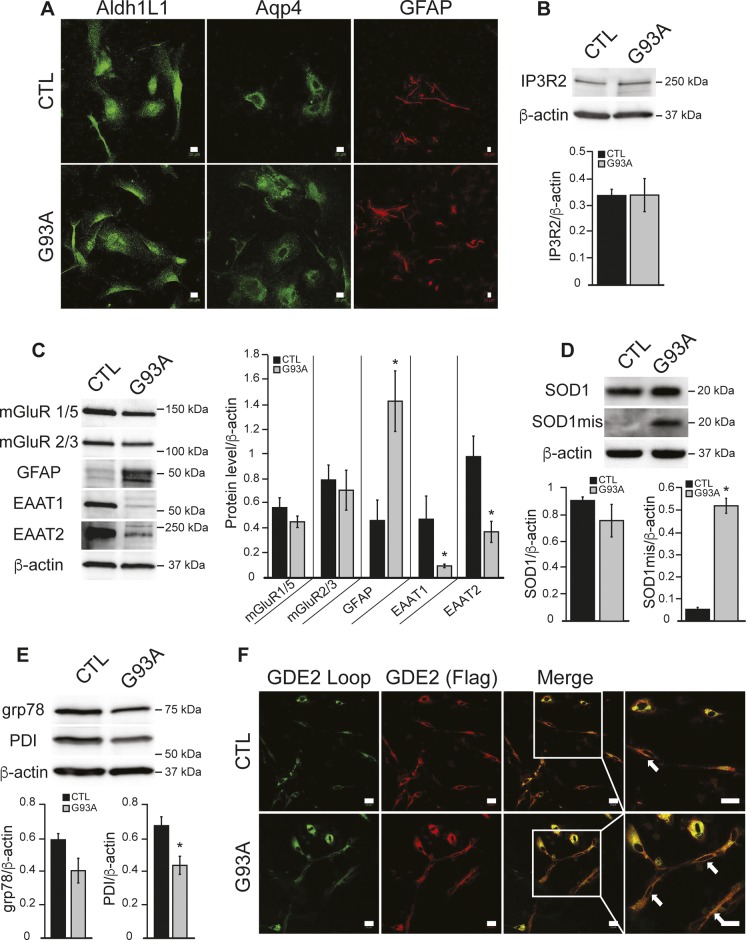
Figure S2. G93A iPSAs express markers of ALS astrocytes and altered ER redox state.
(A) Representative images of CTL and G93A iPSAs immunostained for the astrocytic markers, aldehyde dehydrogenase L1 (AldhL1) aquaporin 4 (Aqp4), and GFAP. (B, C, D, E) Representative Western blots and protein quantifications in CTL and G93A iPSAs, normalized by β-actin, for (B) IP3R2; (C) metabotropic glutamate receptors (mGluR 1/5, mGluR 2/3), GFAP, and glutamate transporters (EAAT 1/2); (D) misfolded SOD1 (SOD1mis) and total SOD1; (E) grp78/Bip and PDI. In (B, C, D, E) n = 3, *P ≤ 0.05 by unpaired t test. (F) Representative images of GDE2-FLAG expressing CTL and G93A iPSAs. Plasma membrane localized GDE2 was detected by the antibody recognizing the external loop region (green) and total GDE2 by the FLAG antibody (red). The scale bars represent 20 μm. Arrows mark cells with surface GDE2 expression.

