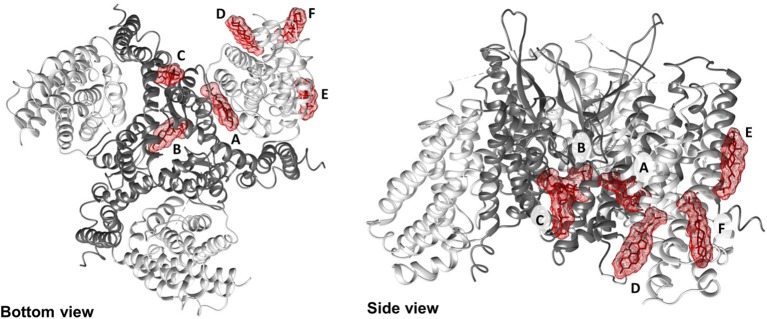
Figure 5.
Docking of cholesterol molecules with hASCT2. Bottom view (left) and side view (right) of the trimeric hASCT2 (PDB: 6GCT). Cholesterol molecules, indicated by letters A, B, C, D, E, and F are depicted as red sticks with mesh surface interacting with the scaffold domain (TMs 1,2,4,5 in dark gray ribbon) and with the transport domain (TMs 3,6,7,8, HP1 and HP2 in the light gray ribbon) of a protomer. The numbering of TMs corresponds to those described in Figure 4. Dotted gray lines indicate missing residues in the 3D structure (PDB: 6GCT). The structure was visualized using Chimera 1.13.1 software.

