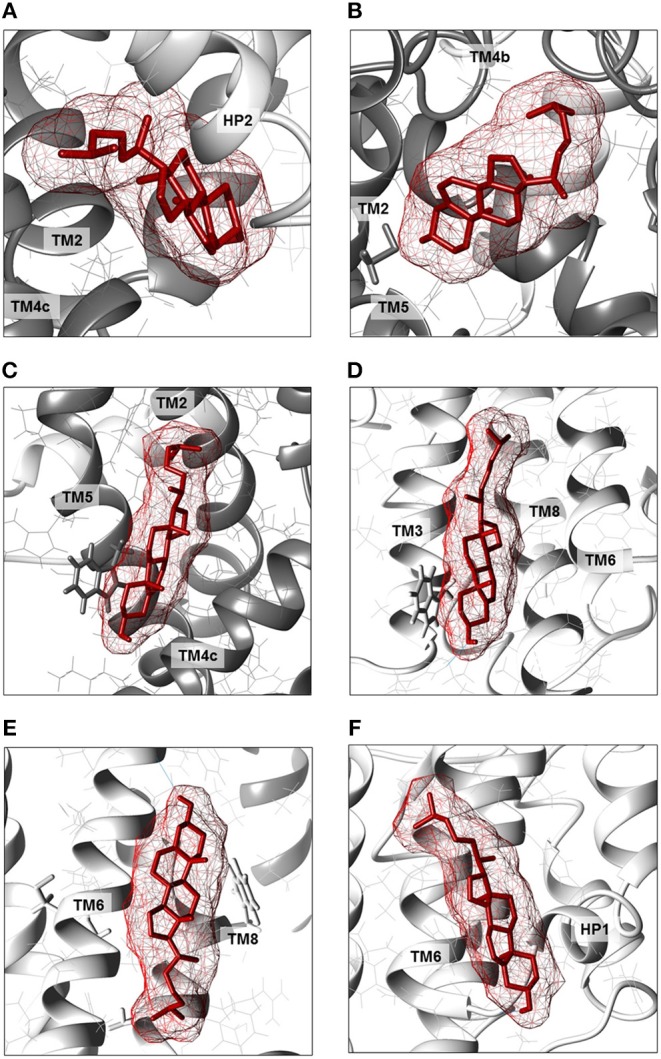
Figure 6.

Enlargements of cholesterol poses. Cholesterol molecules are depicted as red sticks with mesh surface facing to residues of neighboring helices in scaffold domain (dark gray ribbon) or transport domain (light gray ribbon). (A) Cholesterol facing to TMs 2, 4c (scaffold domain) and HP2 (transport domain) of a protomer. (B) Cholesterol facing to TMs 2, 4b and 5 (scaffold domain) of two protomers; in gray stick, residue C110. (C) Cholesterol facing to TM4c (scaffold domain) of a protomer and TM2 and TM5 (scaffold domain) of the adjacent protomer; in gray stick, residue W272. (D) Cholesterol facing to TMs 3, 6 and 8 (transport domain) of a protomer; in gray stick, residue W130. (E) Cholesterol facing to TM6 (transport domain) including CARC motif and TM8 (transport domain); in gray stick, residues C308 and C309 (TM6) and W461 and C467 (TM8). (F) Cholesterol facing to TM6 (transport domain) including CRAC motif and HP1 (transport domain) of a protomer. Except those indicated in gray stick, all residues are indicated as gray wire. The structure was visualized using Chimera 1.13.1 software.
