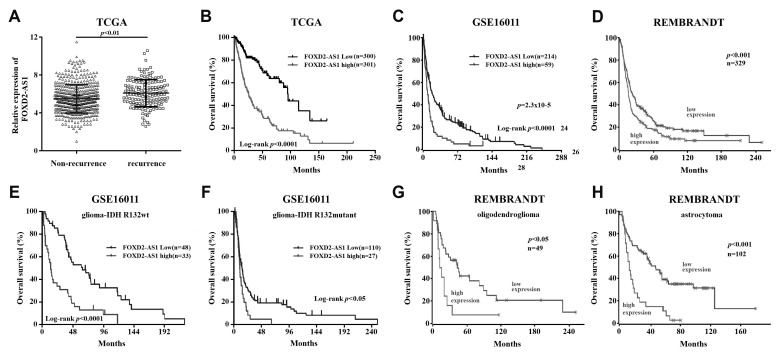
Fig. 1. FoxD2-AS1 is associated with clinical outcome of patients with glioma.
(A) FoxD2-AS1 expression in recurrent glioma tissues and non-recurrent tissues obtained from the Cancer Genome Atlas (TCGA). (B–D) Kaplan–Meier plots of patient outcome based on FoxD2-AS1 expression. (E–H) Kaplan–Meier plots of patient outcome based on FoxD2-AS1 expression in glioma, stratified according to the annotated IDH mutation status and glioma subtype. Data, statistical evaluation, and visualization were obtained using the R2 website “R2: Genomics Analysis and Visualization Platform” (http://r2.amc.nl) and http://www.betastasis.com/. REMBRANDT, Repository for Molecular Brain Neoplasia Data.

