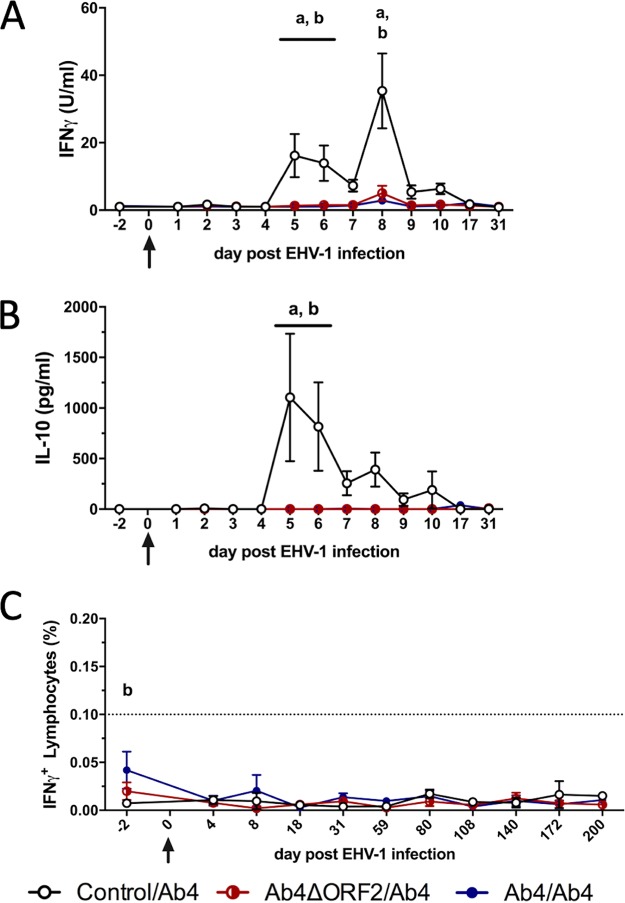
FIG 5.
Cellular immune responses to EHV-1 infection. Three groups of horses (n = 8/group) challenged intranasally with neuropathogenic EHV-1 Ab4 (day 0) 9 months after being noninfected controls (control/Ab4), after primary intranasal infection with Ab4 devoid of open reading frame 2 (Ab4ΔORF2/Ab4), or with Ab4 (Ab4/Ab4). PBMC were isolated and restimulated in vitro with EHV-1 (Ab4). Cytokine production (A and B) was analyzed in supernatants using a fluorescent bead-based multiplex assay. Secreted IFN-γ (A) and IL-10 (B) are shown. EHV-1-stimulated PBMC were also fixed, stained for intracellular IFN-γ, and analyzed using flow cytometry. Total EHV-1-specific IFN-γ-expressing lymphocytes are displayed (C). The dotted horizontal line (C) represents a cutoff of 0.1% IFN-γ+ lymphocytes. PBMC controls kept in medium alone typically result in values below this cutoff value. All values (A to C) are cell culture medium control corrected. Mean and standard errors are plotted. Significant differences between groups are marked as a (control/Ab4 versus Ab4ΔORF2/Ab4) and b (control/Ab4 versus Ab4/Ab4).

