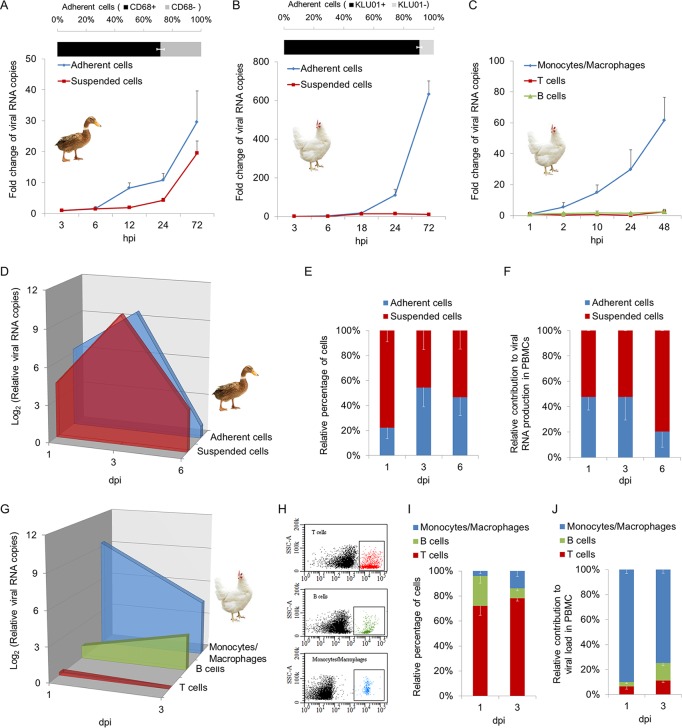
FIG 1.
TMUV tropism for peripheral blood mononuclear cells (PBMCs). (A and B) Monocytes/macrophages and lymphocytes were obtained from freshly isolated PBMCs of 45- to 60-week-old female SPF ducks and chickens by two rounds of differential adhesion. The purities of monocytes/macrophages in adherent cells were identified by rabbit anti-CD68 polyclonal antibody in ducks (A) and by mouse anti-chicken monocyte/macrophage-PE clone KUL01 in chickens (B). Separated cells were infected with TMUV at an MOI of 0.01. The level of viral RNA was detected by RT-qPCR at the indicated times postinfection. Data are presented as the mean ± SEM (n = 3). (C) Monocytes/macrophages, T lymphocytes, and B lymphocytes were sorted and recycled by FACS from freshly isolated chicken PBMCs using mouse anti-chicken monocyte/macrophage-PE clone KUL01, mouse anti-chicken CD3-APC clone CT-3, and mouse anti-chicken Bu-1-FITC clone AV20, respectively. Cells were then infected with TMUV at an MOI of 0.01. The level of viral RNA was detected by RT-qPCR at the indicated times postinfection. Data are presented as the mean ± SEM (n = 3). (D to J) SPF ducks (D to F) or chickens (G to J) were inoculated with 100 μl of TMUV specimens at 1 × 10⁵ PFU per ml via intravenous injection. Duck monocytes/macrophages and lymphocytes were isolated as described for panel A at the indicated time points postinfection. The relative percentages of cells were calculated based on cell counting (E). Chicken monocytes/macrophages, T lymphocytes, and B lymphocytes were isolated as described for panel C at the indicated time points postinfection. (H and I) The relative percentages of cells were detected by FACS. Representative flow plots are shown (H). Data are presented as the mean ± SEM (n = 3). (D and G) The level of viral RNA was detected by RT-qPCR. Data are presented as the mean ± SEM (n = 3). (F and J) The relative contribution to the total level of viral RNA in PBMCs by isolated cells was calculated. Data are presented as the mean ± SEM (n = 3).

