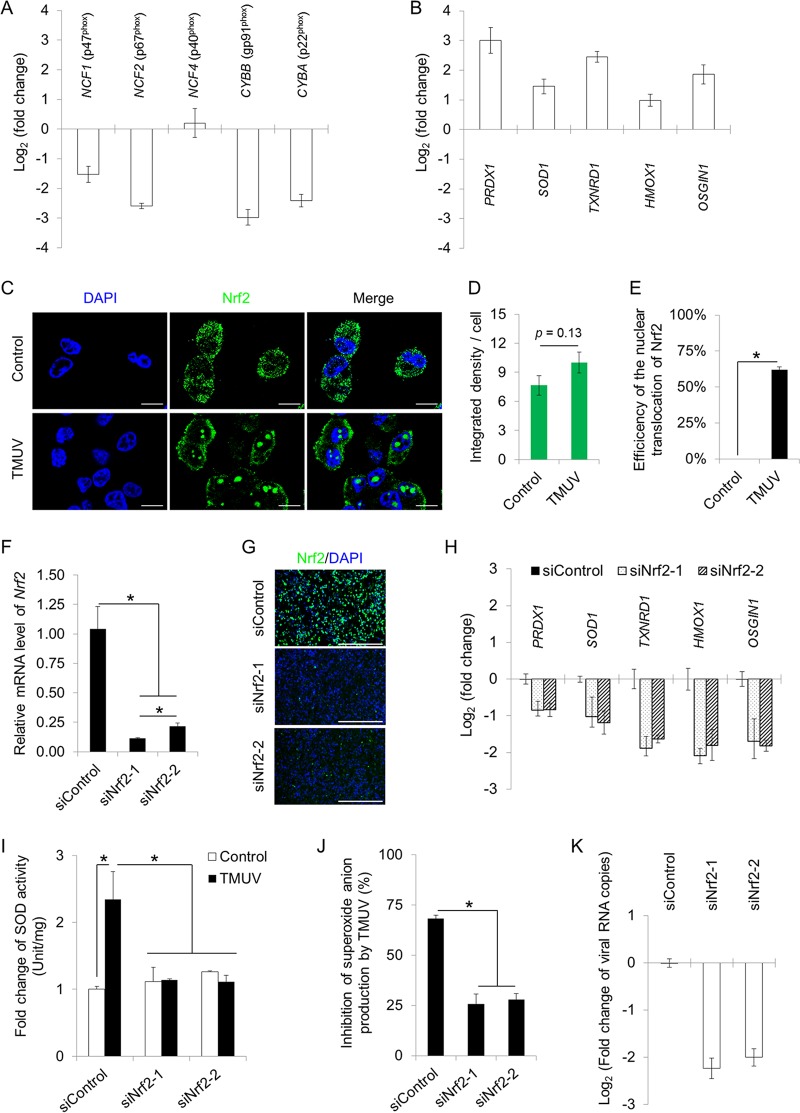
FIG 6.
TMUV maintains intracellular redox homeostasis in macrophages. (A) The effects of TMUV infection on the transcription of NADPH oxidase subunits were assayed by RT-qPCR. Data are presented as the mean ± SEM (n = 3). (B) The effects of TMUV infection on the transcription of five antioxidant genes were assayed by RT-qPCR. Data are presented as the mean ± SEM (n = 3). (C) The effects of TMUV infection on Nrf2 expression and cellular location were examined by confocal microscopy using rabbit multiclonal antibodies specifically recognizing the C terminus of Nrf2, followed by an FITC-conjugated anti-rabbit secondary antibody. Cell nuclei were stained with DAPI (blue). Scale bars, 10 μm. (D) The integrated density of the fluorescent signal was quantified statistically with ImageJ. Data are presented as the mean ± SEM (n = 6). (E) The percentage of cells with Nrf2 nuclear translocation per field was quantified statistically by observing 100 cells per slide. Data are presented as the mean ± SEM. Asterisks indicate significant differences (n = 6, P < 0.05). (F and G) The efficiency of Nrf2 knockdown was verified by RT-qPCR (F) and immunofluorescent staining (G). Data in panel F are presented as the mean ± SEM. Asterisks indicate significant differences (n = 3, P < 0.05). Scale bar in panel G, 400 μm. (H) The effects of Nrf2 knockdown on the transcription of five antioxidant genes were assayed by RT-qPCR. Data are presented as the mean ± SEM (n = 3). (I and J) The effects of Nrf2 knockdown on the repression of SOD activity (I) and cellular superoxide production (J) by TMUV infection (MOI = 1) in HD11 cells were detected using a SOD activity assay kit and a WST-1-based superoxide assay kit, respectively. The absorbance was read at 450 nm. The SOD activity and the inhibition rate of superoxide production by TMUV infection were calculated. Data in panels I and J are presented as the mean ± SEM. Asterisks indicate a significant difference (n = 3, P < 0.05). (K) The effect of Nrf2 knockdown on TMUV RNA production was determined by RT-qPCR. Data are presented as the mean ± SEM (n = 3).

