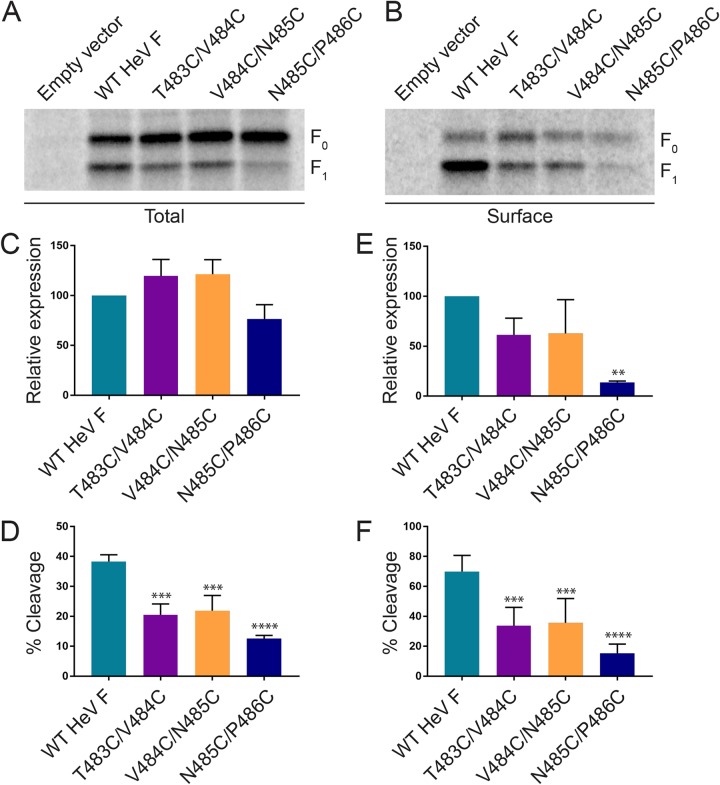
FIG 4.
Cell surface expression is variably reduced for the HeV F TMD mutants. Total (A) and surface (B) expression levels were analyzed using a biotinylation method. Vero cells were transfected with WT HeV F or one of the TMD mutants. At 24 h posttransfection, the cells were metabolically labeled for 4 h, followed by biotinylation of the surface proteins and immunoprecipitation. The samples were analyzed by 15% SDS-PAGE. Total expression (F0+ F1) and cleavage [F1/(F0+F1)] (C and D), as well as surface expression and cleavage (E and F) were quantified by densitometry and normalized to levels for WT HeV F. All data are represented as the means ± standard deviations for three independent experiments. Statistical analyses were performed using a two-way analysis of variance with a Bonferroni correction. Asterisks indicate statistical significance compared to values for the WT HeV F (**, P < 0.01; ***, P < 0.001; ****, P < 0.0001).

