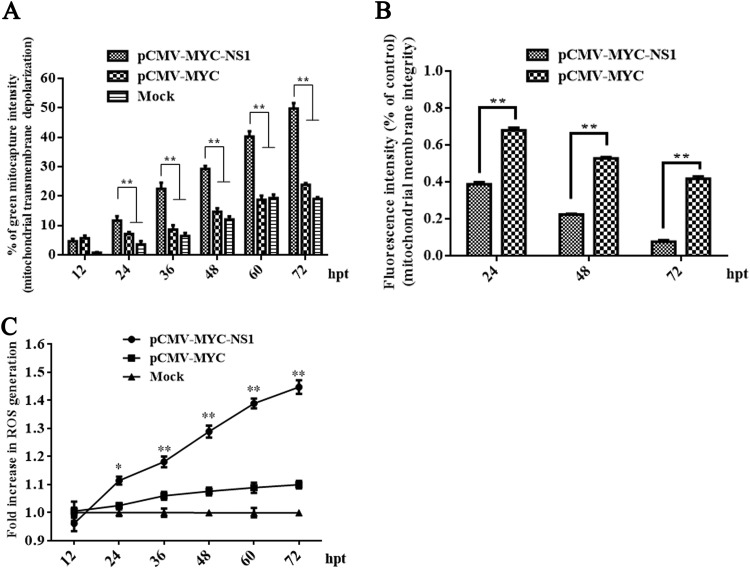
FIG 6.
NS1-induced mitochondrial damage with an accumulation of ROS. (A) NS1-induced mitochondrial transmembrane potential depolarization. HEK293T cells were transfected with plasmids as indicated, incubated with MitoCapture reagent, and analyzed by flow cytometry at different time points posttransfection. Vector- and mock-transfected cells were used as negative controls. (B) Loss of mitochondrial membrane integrity in NS1-transfected HEK293T cells. Transfected and stained HEK293T cells were captured as overlay histograms. The bar chart presents the significant increase in apoptotic cells with reduced mitochondrial membrane potential after NS1 transfection. (C) Accumulation of ROS in NS1-transfected HEK293T cells. NS1-transfected HEK293T cells were analyzed at different time points posttransfection, and the production of intracellular ROS was determined fluorometrically. The linear graph presents the increased production of ROS in the NS1-transfected cells compared to the mock and vector-transfected cells. Data are expressed as the means ± SEMs and are representative of results from three independent experiments. *, P < 0.05, and **, P < 0.01, versus the mock control.

