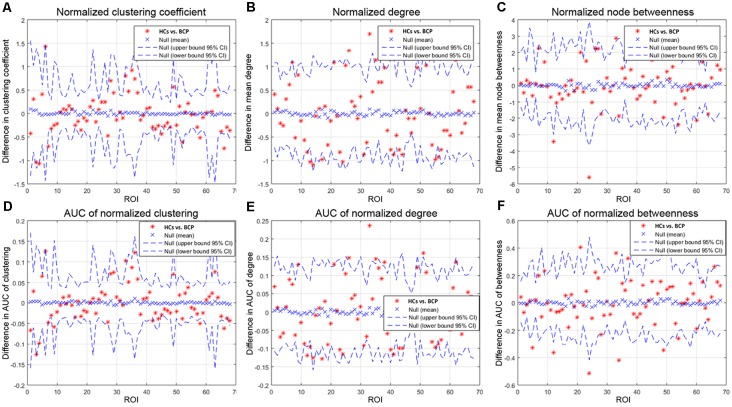
Figure 5.
Between-group differences of measures [normalized clustering coefficient (A), degree (B), and node betweenness (C)] across a range of network densities (i.e., AUC results). The red star indicates the difference between the two groups. All regions survive following FDR correction (p < 0.05). The BCP group exhibits a significantly different AUC for network metrics [normalized clustering (D), p = 0.02; small-worldness (E), p = 0.02; transitivity (F), p = 0.04] as compared with the HCs. BCP, bilateral cerebral palsy. AUC, area under the curve.

