Figure 6.

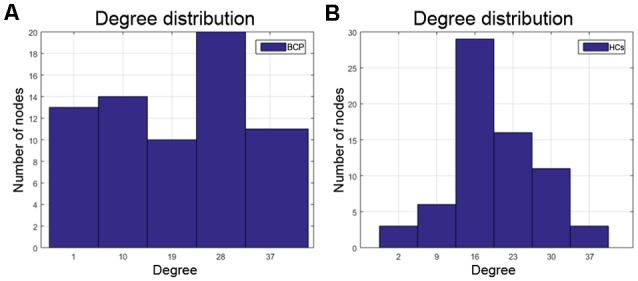
The degree distribution in BCP is non-normal (A), which may represent a kind of disorder. The degree distribution of HCs is relatively normal (B). BCP, bilateral cerebral palsy; HCs, healthy controls.

The degree distribution in BCP is non-normal (A), which may represent a kind of disorder. The degree distribution of HCs is relatively normal (B). BCP, bilateral cerebral palsy; HCs, healthy controls.