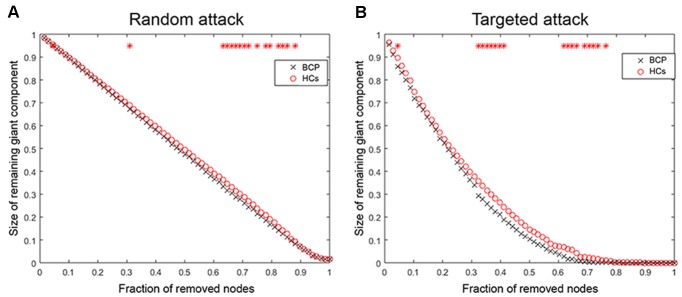
Figure 7.
Random and targeted attack analysis. Alterations in the size of the largest preserving component of the network are shown as a function of a fraction of randomly (A) and targeted (B) removed nodes. In many proportions of the deleted nodes and the AUC results, there was no significant difference between the two groups (p > 0.05) of the resilience of the networks to both targeted and random attacks. AUC, area under the curve. BCP, Bilateral cerebral palsy.

