
Figure 3.
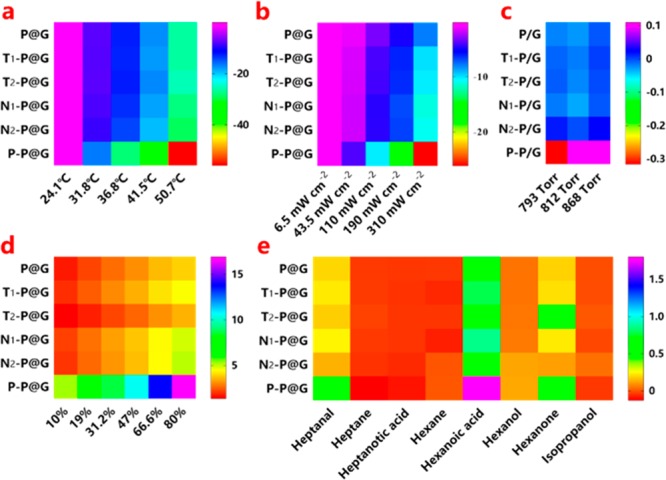
Heat maps represent the responses of BLSA to temperature (a), light exposure (b), air pressure (c), relative humidity (d), and volatile organic compounds (e).
Official websites use .gov
A
.gov website belongs to an official
government organization in the United States.
Secure .gov websites use HTTPS
A lock (
) or https:// means you've safely
connected to the .gov website. Share sensitive
information only on official, secure websites.
Heat maps represent the responses of BLSA to temperature (a), light exposure (b), air pressure (c), relative humidity (d), and volatile organic compounds (e).