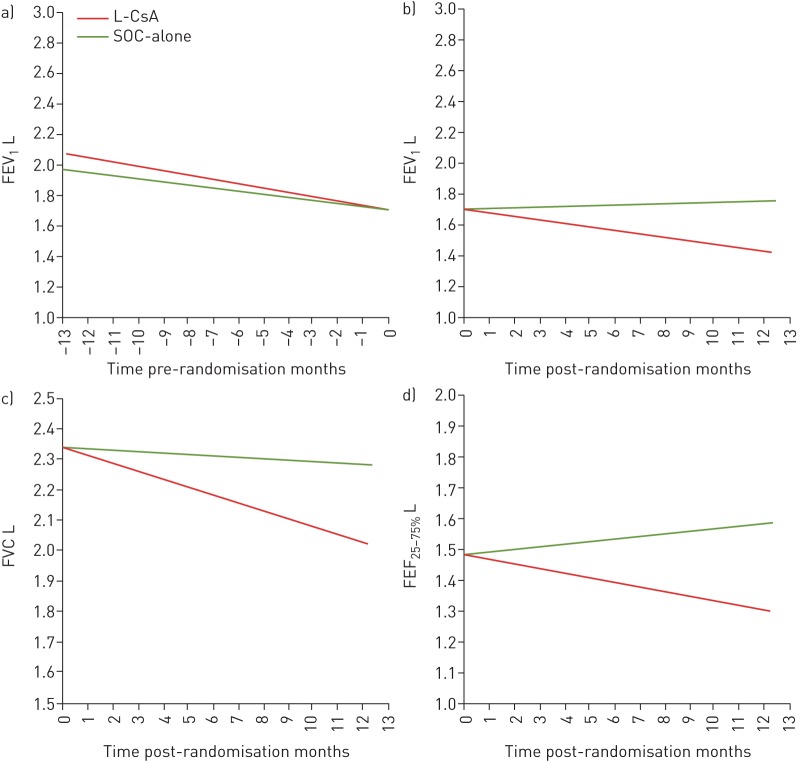
FIGURE 3.
a, b) Comparisons of forced expiratory volume in 1 s (FEV1) over time, analysed by multivariate linear mixed effects in the liposomal cyclosporine (L-CsA) and standard of care (SOC)-alone arms, analysed a) before and b) after randomisation to the respective arms of the trial. In the year prior to randomisation, FEV1 slopes were similar between the L-CsA and SOC-alone groups (pre-randomisation ΔFEV1 −0.021 (95% CI −0.032– −0.011) versus −0.028 (95% CI −0.039– −0.018) L·month−1; p=0.3). The post-randomisation ΔFEV1 demonstrated stability for the L-CsA arm (+0.005 (95% CI −0.004– +0.013) L·month−1) compared with significant deterioration in the SOC-alone arm (−0.025 (95% CI −0.035– −0.015) L·month−1) (p<0.0001). Within-group pre- and post-randomisation FEV1 analyses (L-CsA and SOC-alone, analysed distinctly) demonstrated improvement in patients after randomisation to L-CsA compared with ΔFEV1 decline prior to randomisation while receiving SOC-alone (pre-randomisation ΔFEV1 −0.021 (95% CI −0.032– −0.011) L·month−1 versus post-randomisation +0.005 (95% CI −0.004– +0.013) L·month−1; p=0.0002). In contrast, patients in the SOC-alone arm demonstrated continued FEV1 decline after randomisation similar to pre-randomisation values (pre-randomisation ΔFEV1 −0.028 (95% CI −0.039– −0.018) L·month−1 versus post-randomisation −0.025 (95% CI −0.035– −0.015) L·month−1; p=0.3). c, d) Comparisons of c) forced vital capacity (FVC) and d) forced expiratory flow at 25–75% of FVC (FEF25–50%) over the 48-week post-randomisation period in the L-CsA and SOC-alone arms, analysed after randomisation and compared between patient groups with their respective arms of the trial. For ΔFVC, L-CsA versus SOC-alone: −0.005 (95% CI −0.015– +0.006) and −0.026 (95% CI −0.039– −0.014) L·month−1) (p=0.009). For ΔFEF25–75%, L-CsA versus SOC-alone: +0.008 (95% CI −0.015– +0.031) and −0.015 (95% CI −0.042– +0.011) L·month−1 (p=0.1).

