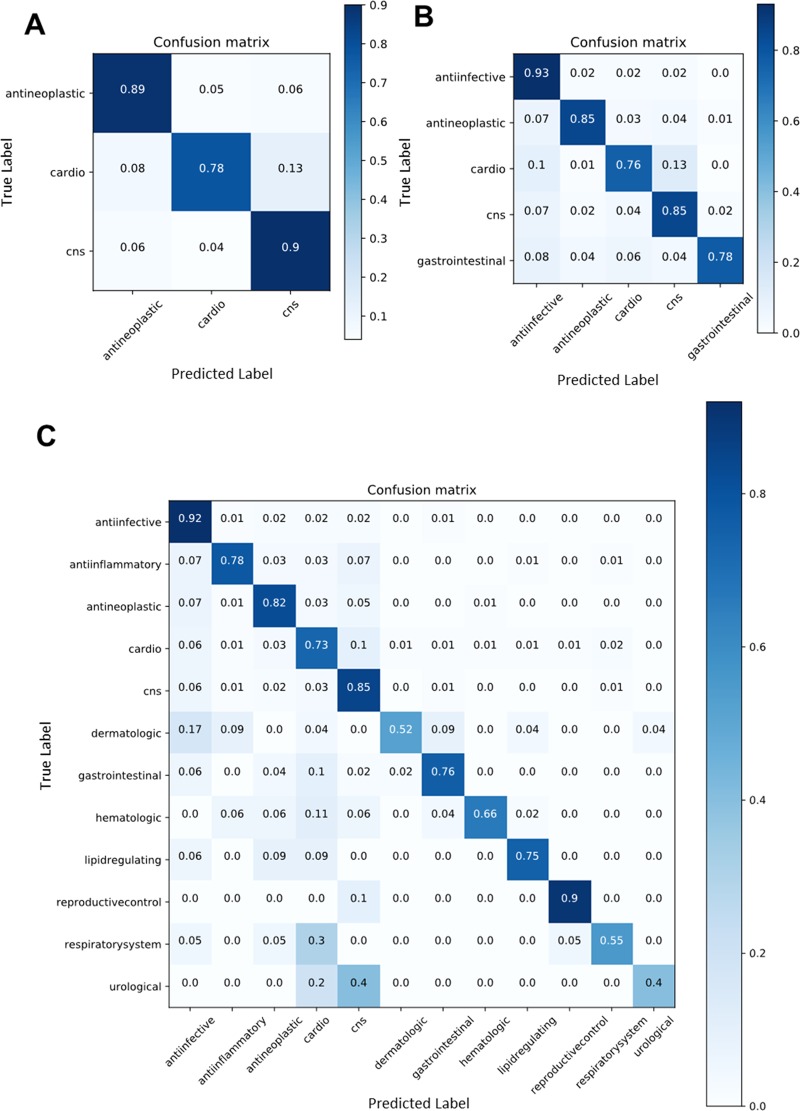
Figure 3.
Confusion matrices from IMG + CNN classifiers showing the proportion of each predicted class (x axis) for molecules in each true class (y axis). Results are from the (A) 3-, (B) 5-, and (C) 12-class task subgroups. Each matrix shows the predictions from the fifth validation set using IMG + CNN models trained on the large single-class data set.

