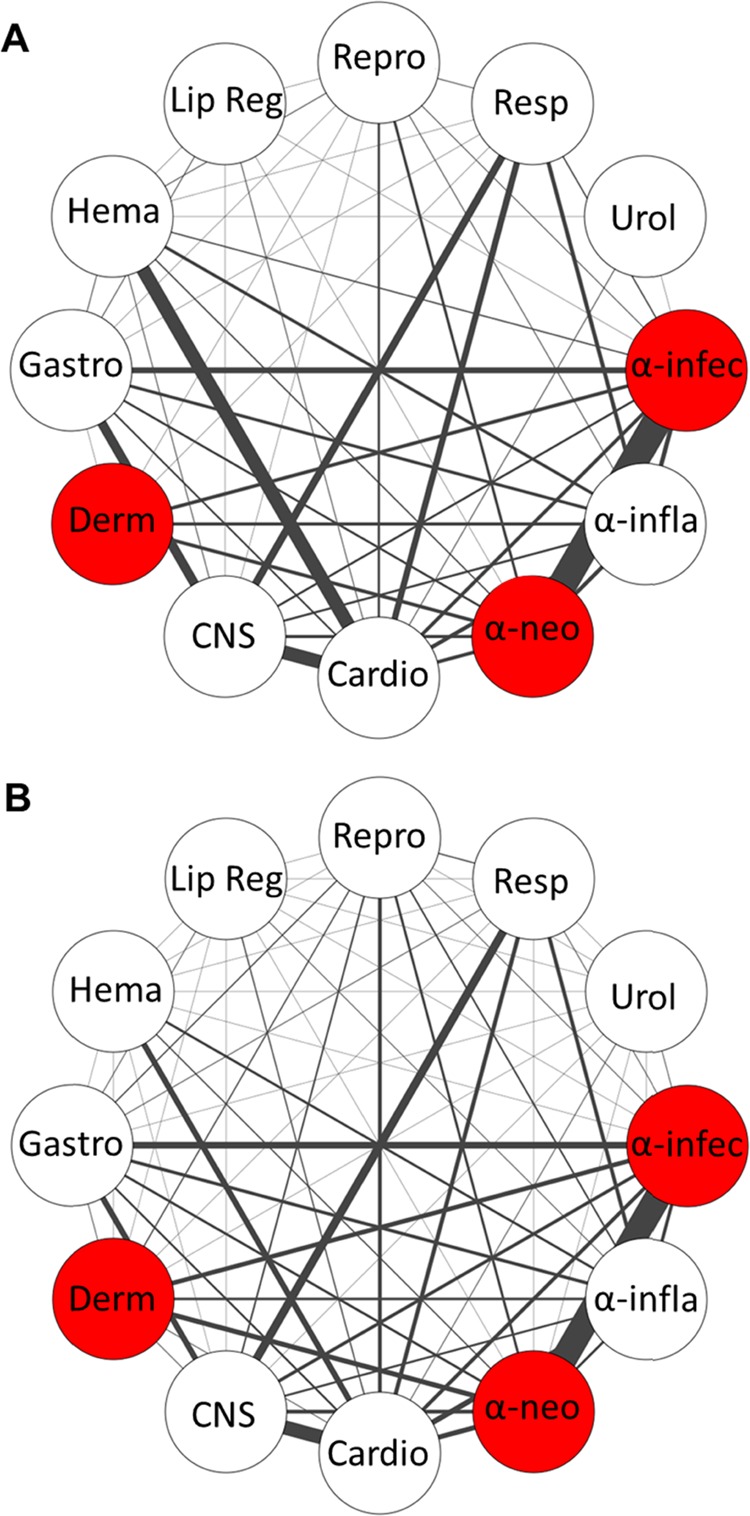
Figure 7.

Analysis of multilabel drug classification using the IMG + CNN model. A network of relationships was computed from the (A) true class labels or (B) predicted class labels of the first validation fold. The width of each edge denotes the strength or frequency of co-occurrence. Red nodes indicate class grouping determined by their co-occurrence.
