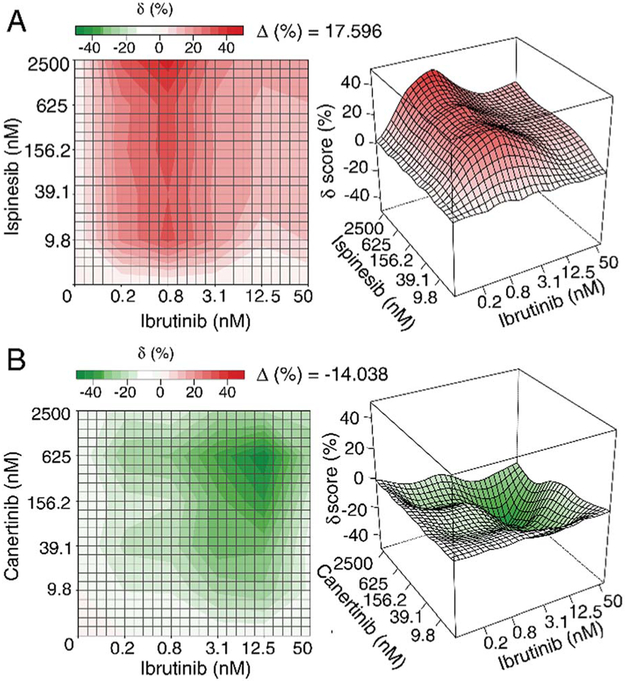
Fig. 3.
Example of synergistic (top) and antagonistic (bottom) interaction landscapes using delta scores (δ) calculated with the zero interaction potency model of compounds in combination with ibrutinib, an approved anti-cancer drug targeting Bruton's tyrosine kinase. (A) Interaction map between anti-cancer activity of ispinesib (a selective kinesin spindle protein inhibitor) and ibrutinib. Average delta across the dose–response matrix (Δ) is 17.596, indicative of overall synergy. (B) Interaction map between canertinib (an epidermal growth factor receptor family inhibitor) and ibrutinib. The Δ value is −14.038, indicative of overall antagonism. Figure is reprinted with permission from Yadav et al. 2015.47

