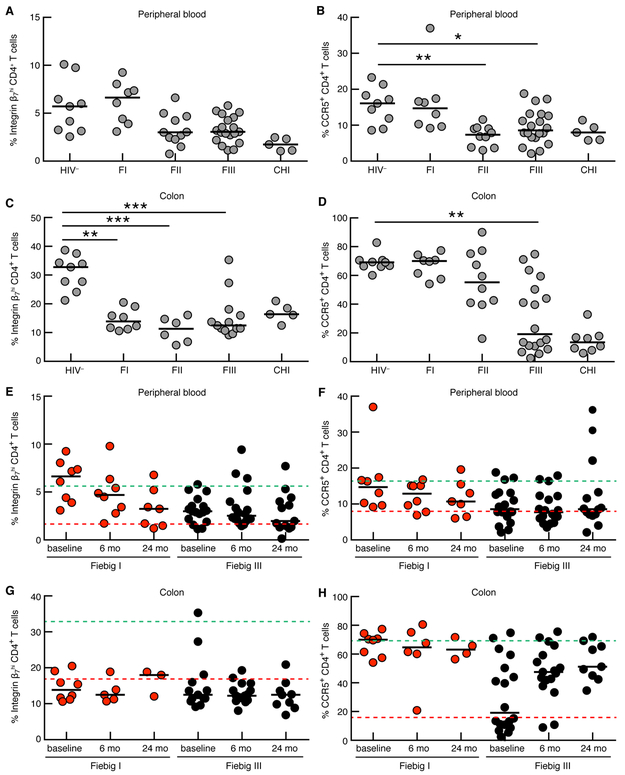
Figure 3. Depletion and post cART recovery of β7Hi and CCR5+ CD4+ T cells in peripheral blood and cells isolated from sigmoid colon during acute infection in RV254.
Frequencies of (A) β7Hi and (B) CCR5+ CD4+ T cells in the peripheral blood at different Fiebig (F) stage [HIV- (n=9), FI (n=8), FII (n=11), FIII(n=20) and chronic HIV infected (CHI, n=5)] C) Frequencies of β7Hi CD4+ T cells in the colon [HIV- (n=9), FI (n=8), FII (n=6), FIII(n=13) and CHI (n=5)] D) Frequencies of CCR5+ CD4+ T cells in the colon [HIV- (n=9), FI (n=8), FII (n=10), FIII(n=18) and CHI (n=8)]. Frequencies of (E) β7Hi and (F) CCR5+ CD4+ T cells in the peripheral blood following ART initiation in either FI [red data points, at baseline (n=8), 6m(n=8), 24m(n=7)] or FIII [black data points, at baseline (n=18), 6m(n=18) and 24m(n=14)]. (G) Frequencies of β7Hi CD4+ T cells in the colon following ART initiation in either FI [red data points, baseline (n=8), 6m(n=5), 24m(n=3)] or FIII [black data points, baseline (n=13), 6m(n=15) and 24m(n=9)] (H) CCR5+ CD4+ T cells in the colon following ART initiation in either FI [red data points, at baseline (n=8), 6m(n=6), 24m(n=4)] or FIII [black data points, at baseline (n=18), 6m(n=17) and 24m(n=9)]. The dashed lines represent the median of cells in healthy control participants (green, n=9) and in CHI patients (red, n=5). For A to D, Kruskal Wallis test was used followed by a Dunn’s multiple comparisons test to look for differences between HIV uninfected (HIV−) group and groups at different Fiebig stages. For E to H Friedman test was used to test for significant differences within each ART initiation group (FI and FIII). *P<0.05, **P< 0.01 and ***P<0.001.

