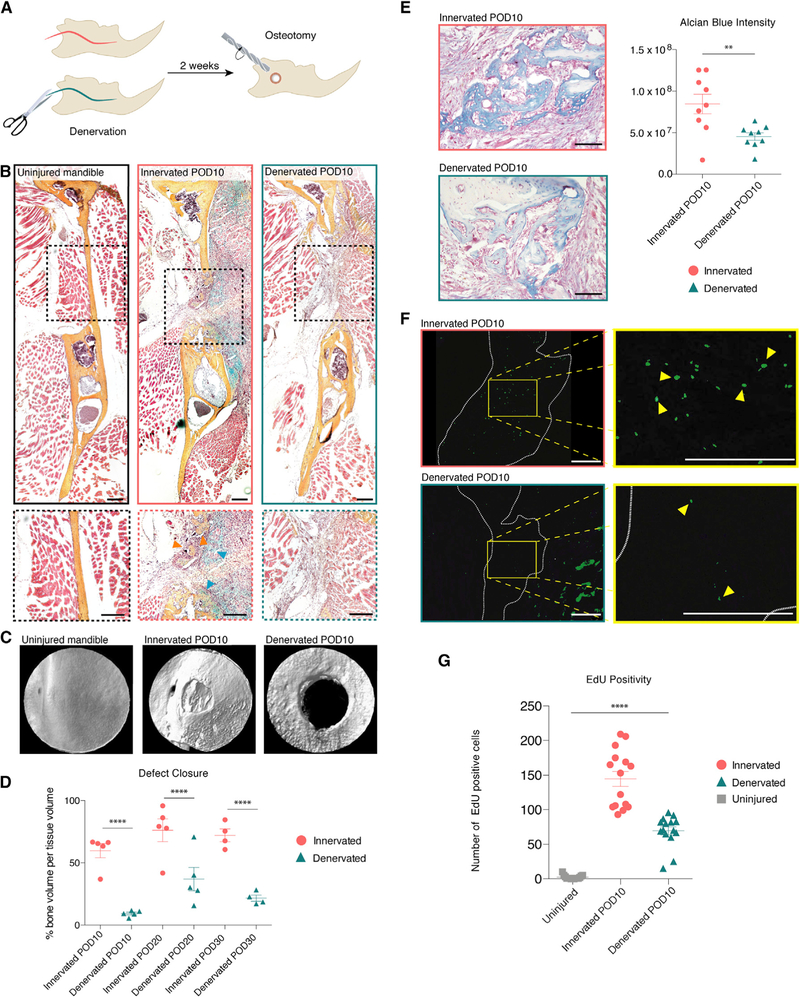
Figure 2. Mandibular Healing Exhibits Nerve Dependency with Impaired Progenitor Activity in Denervated Mandibles.

(A) Schematic of experimental design.
(B) Pentachrome stain of uninjured mandible (left), innervated defect (middle), and denervated defect (right) harvested at POD 10. Bottom panels zoom in on the defect area. Orange arrows denote new bone mineralization and blue arrows denote cartilage formation (middle bottom). n = 10.
(C) Three-dimensional (3D) reconstruction of μCT scan of uninjured (left), innervated (middle), and denervated (right) mandible defects.
(D) Quantification comparing bone volume per tissue volume at PODs 10, 20, and 30 after mandibular osteotomy in innervated (circles) and denervated (triangles) mandibles. n = 5
(E) Alcian blue staining identifies cartilageat POD 10after osteotomy in innervated (top left) and denervated (bottom left) mandible defects. Quantification (right) of blue staining. n = 5.
(F) EdU labeling (green) at POD 10 (innervated, upper panel, and denervated, bottom panel). Yellow outline signifies zoomed area (right). White dotted line indicates mandibular defect area. Yellow arrows mark EdU positive cells (right).
(G) Quantification comparing EdU positivity in uninjured (squares), innervated defect (circles), and denervated defect (triangles). n = 5.
Scale bars, 200 μm (B and F) and 100 mm (E). μCT resolution, 10 μm (C). Error bars denote SEM (D and G). Statistical comparisons were made using t tests (D) and ANOVA (G). See also Figure S1.
