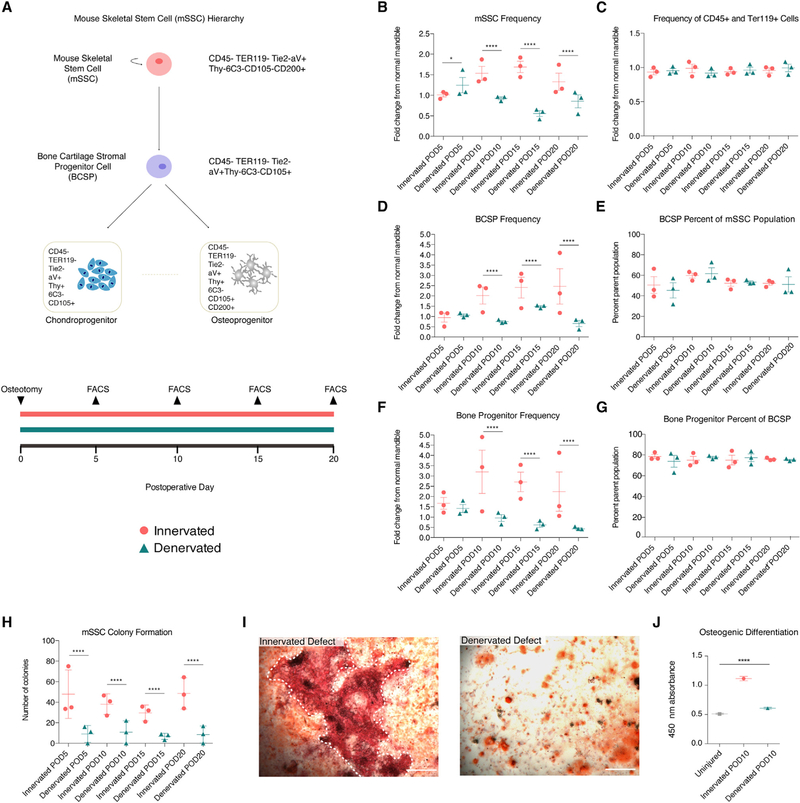
Figure 3. Mouse Skeletal Stem Cells in Healing Mandible Bone Are Nerve Dependent.
(A) Schematic of the mSSC hierarchy (top) and experimental timeline (bottom).
(B) mSSC cellular frequencies post-osteotomy in innervated (circles) and denervated (turquoise) mandibles at multiple postoperative days.
(C) Cellular frequencies of CD45-positive and Terr119-positive cells in innervated (circles) and denervated (triangles) mandibles.
(D) BCSP cellular frequencies post-osteotomy in innervated (circles) and denervated (triangles) mandibles.
(E) Percentage BCSP cells within parent mSSC population post-osteotomy in innervated (circles) and denervated (triangles) mandibles.
(F) Bone progenitor cellular frequencies post-osteotomy in innervated (circles) and denervated (triangles) mandibles.
(G) Percentage bone progenitors within parent BCSP population post-osteotomy in innervated (circles) and denervated (turquoise triangles) mandibles.
(H) Colony formation units of mSSC isolated from innervated (circles) and denervated (triangles) mandibles.
(I) Alizarin red staining of POD 10 mSSCs from innervated (left) and denervated (right) defects. White dotted line indicates large bony nodule (left).
(J) Quantification of alizarin red absorbance after osteogenic differentiation.
Scale bars, 400 μm (I). For (B)–(H), n = 5 biological replicates per condition with three technical replicates. Cellular frequencies were normalized to cellular frequencies from uninjured mandibles. For (I) and (J), n = 10 biological replicates per condition with three technical replicates. Error bars represent SEM (B–H and J), and statistical comparisons were made using t tests (B–H) and ANOVA (J). See also Figure S1

