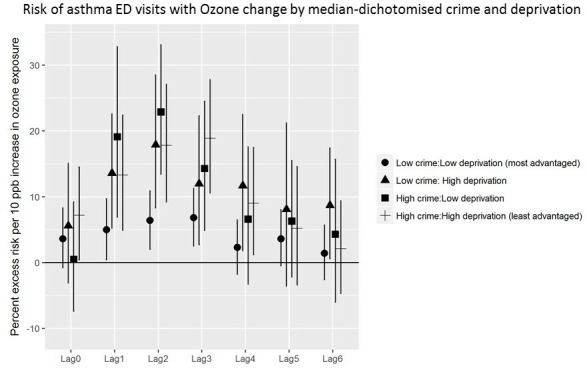
Figure 4.

Ozone by median-dichotomised violent crime and socioeconomic deprivation interaction on childhood asthma emergency department (ED) visit risk, 2005–2011, in NYC. X-axis includes lag days 0–6. Y-axis is percentage of excess risk per 10 ppb increase in ozone exposure. Shapes represent four categories cross-stratified by median-dichotomised violent crime and socioeconomic deprivation (low crime/low deprivation; low/high; high/low; high/high).
