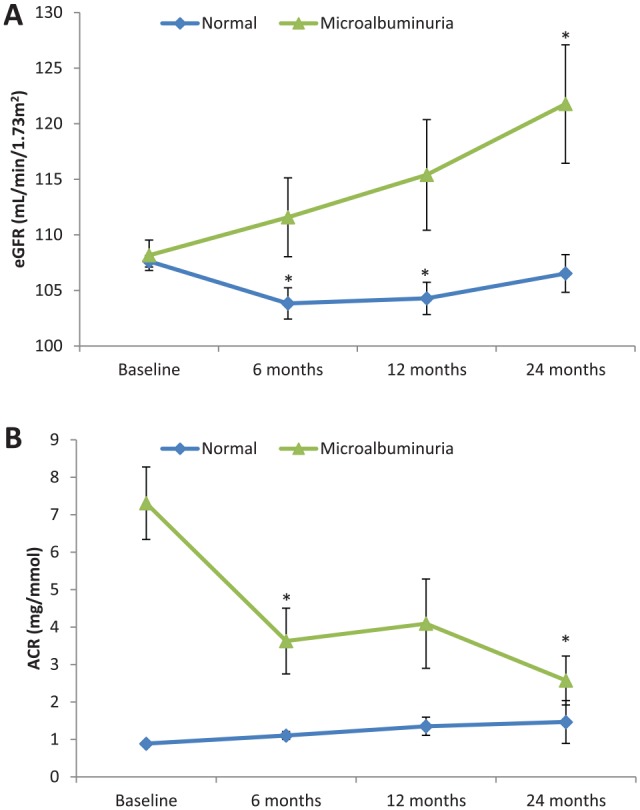
Figure 2.

Two-year follow-up evaluation of estimated glomerular filtration rate (A) and albumin/creatinine ratio (B) in the cohort stratified according to the presence of baseline proteinuria.
Note. Estimated marginal means and standard error are presented at each time point using linear mixed model analysis. Asterisks (*) indicate significant change from baseline (P < .05) using Bonferroni adjustment to account for multiple comparisons.
