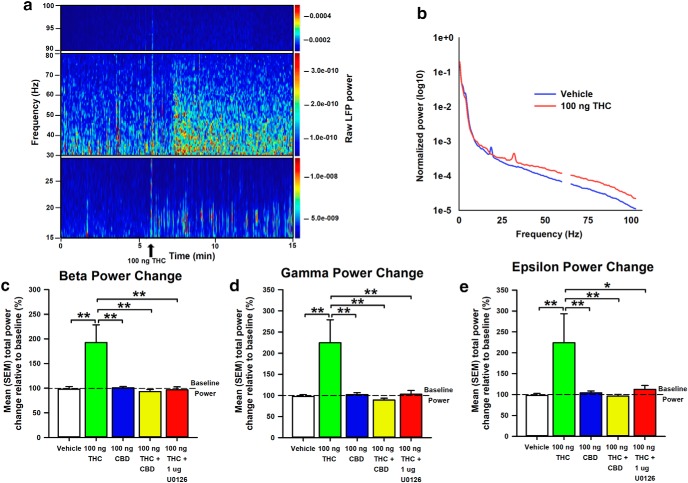
Figure 6.
Effects of intra-vHipp VEH, THC (100 ng), CBD (100 ng), THC+CBD (100 ng+100 ng), and THC+U0126 (100 ng+1 μg) exposure on β (15–30 Hz), γ (30–80 Hz), and ε (90–100 Hz) oscillatory power in the VTA of a urethane anesthetized rat. a, Representative spectrogram showing temporal changes in the power of intra-VTA oscillations at different frequencies. The power values are color-coded as indicated on the right-hand side insets. A peak at ∼60 Hz reflect power line frequency and the LFP power values for frequencies between 59 and 61 Hz were excluded from further analysis. b, Average normalized power spectra corresponding to LFP of VEH-treated (blue) and THC-treated (red) rats. Note the increased power of β (15–30 Hz), γ (30–80 Hz), and ε (90–100 Hz) bands in THC-treated rats. c–e, Bar graphs summarizing the average total power change of the different frequency bands after intra-vHipp drug microinfusion. n = 12–16 from n = 4–6 rats, one-way ANOVAs; *p < 0.05, **p < 0.01. Error bars indicate SEM.

